Chemistry Reference
In-Depth Information
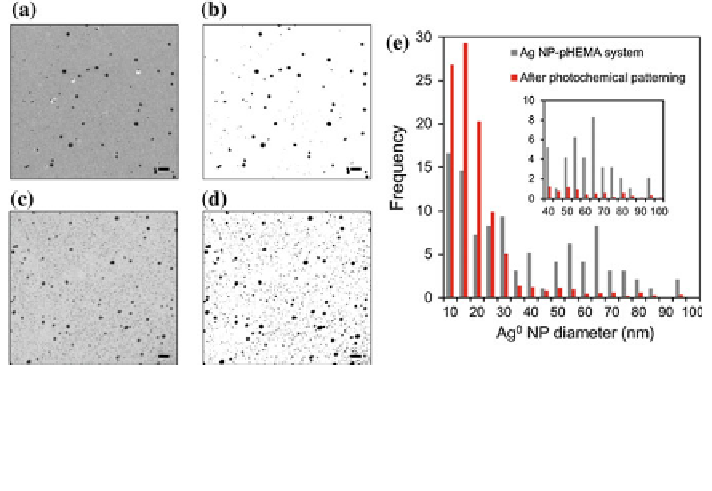
Fig. 3.8 TEM images of the cross sections of the pHEMA + Ag
0
NP system representing non-
patterned and patterned regions at
m below the polymer surface. a Photographic image
image, b Threshold before laser-induced patterning, c Photographic image, d Threshold after laser-
induced patterning. Scale bars 200 nm. e Size distributions of Ag
0
NPs before and after laser-
induced photochemical patterning in pHEMA matrix
5
10
µ
*
-
The interaction between the laser light and the NPs in situ may also in
uence
particle diffusion, oxidation, structure and distribution [
32
-
34
]. The outlined factors
above contribute to organising the NPs in the polymer matrix.
fl
3.3.2 Effective Index of Refraction Measurements
While direct measurements were taken by an Abb
refractometer with an LED,
indirect measurements were obtained using a plano-convex lens. The pHEMA
matrices were lifted off from their substrates, lubricated with an index matching
é
fluid,
and placed on the reading plate of the refractometer. Indirect measurements of the
index of refraction were obtained by the consecutive focus point distance measure-
ments of a plano-convex lens immersed in various solutions and pHEMA layer. The
focal points at air (n = 1.00), water (n = 1.33), ethanol (n = 1.36) and decane (n = 1.41)
were measured by placing the lens, convex side down, in a glass Petri dish, and
submerging the lens into these solvents. A monomer mixture consisting of HEMA
(91.5 mol%), EDMA (2.5 mol%), MAA (6 mol%) solution was polymerised with a
lens in the Petri dish, followed by the measurement of focal length of water saturated-
hydrogel system. Finally, the index of refraction of water-hydrogel system was
extrapolated based on the reference focal length measurements of air, water, ethanol
and decane. The effective index of refraction of the non-patterned hydrogel (pHEMA,
Ag
0
NPs) was 1.46
fl
±
0.01, and it decreased to 1.43
±
0.01 after laser-induced