Chemistry Reference
In-Depth Information
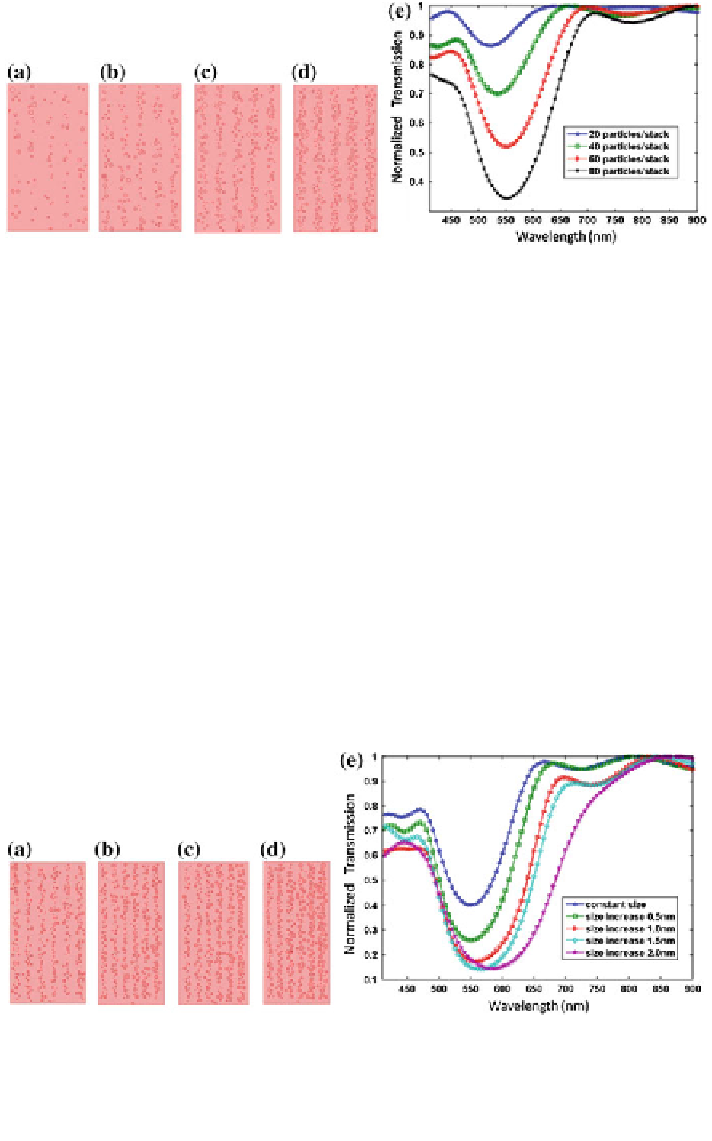
Fig. 2.12 Simulated geometry and the transmission spectra of the holographic sensor as the
number of Ag
0
NP stacks was varied. a 20, b 40, c 60 and d 80 Ag
0
NPs per stack. e The
transmission spectra for 20
-
80 Ag
0
NP per stack. Reproduced from Ref. [
83
] with permission
from The Royal Society of Chemistry
Inhomogeneous Ag
0
NP distribution through the hydrogel matrix may affect the
optical properties of the sensor. The effect of anomalies in the holographic sensor
was evaluated by simulating four con
gurations, in which the mean radii of the Ag
0
NPs differed (Fig.
2.13
). Distortions are normally present in laser-directed fabrica-
tion of holograms, since the Ag
0
NPs are introduced into the polymeric matrices
through a diffusion and photographic development, leading to inhomogeneous
distribution of NP regions within the hydrogel matrix [
98
]. The simulated geome-
tries contained six stacks, and they all began with the
first stack of Ag
0
NP mean
gurations with Ag
0
NP mean radius
that increased by 0.5 nm per stack from 10 to 12 nm. The simulations allowed
evaluation of errors due to uncontrolled Ag
0
NP during holographic sensor fabri-
cation. The transmission spectra in Fig.
2.13
e show a reference curve for which there
is a constant mean radius along all the stacks with the remaining curves representing
radius of 10 nm. Figure
2.13
a
-
d shows the con
Fig. 2.13 Simulated transmission spectra of the holographic sensor as a function of increasing
Ag
0
NP mean radius. Starting from 10 nm, the Ag
0
NP mean radius was increased by a 0.5, b 1.0,
c 1.5 and d 2.0 nm per stack. e Transmission spectra of these configurations as compared to a
pattern with constant mean radii. Reproduced from [
83
] with permission from The Royal Society
of Chemistry