Chemistry Reference
In-Depth Information
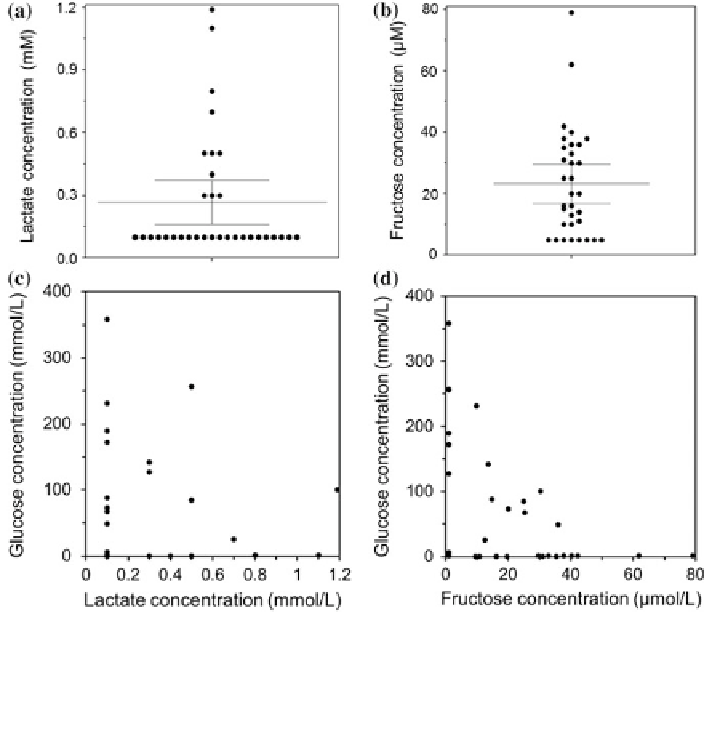
Fig. 5.20 Assessment of lactate and fructose interference in urinalysis. Measurements of a lactate
b fructose concentrations middle horizontal lines in (a, b) are means. Error bars represent upper
and lower 95 % confidence intervals of the mean. Comparison of c lactate and d fructose
concentrations with inferred glucose concentrations from the holographic sensors. Reprinted with
permission from [
29
] Copyright 2014 The American Chemical Society
fructose control from sample readouts. The fructose standard curve was plotted, and
the fructose concentrations of test samples were read from the standard curve.
Figure
5.19
b, c shows the lactate and fructose measurements for each sample.
The secondary axes in Fig.
5.19
b, c show the predicted Bragg peak shifts for lactate
and fructose measurements, respectively. Figure
5.20
a illustrates scatter dot plot of
the measured lactate concentration values
(
µ
= 0.27 mM, 95 % CI
low-
high
= 0.16
-
0.37 mM), while Fig.
5.20
b shows the measured fructose concentration
µ
µ
µ
values (
= 23.18
M, 95 % CI
low-high
= 16.93
-
29.43
M). Such concentrations
±
±
caused slight interferences of 3.48
0.44 % (fructose)
in the presence of urine glucose. However, for the present analysis, it was redundant
to calibrate the sensor due to lactate and fructose measurements since the inter-
ference due to these analytes was negligible. Figure
5.20
c, d shows the inferred
glucose values from the holographic sensor readouts plotted against lactate and
fructose measurements using Dimension
®
Clinical Chemistry System and
0.01 % (lactate) and 2.90