Chemistry Reference
In-Depth Information
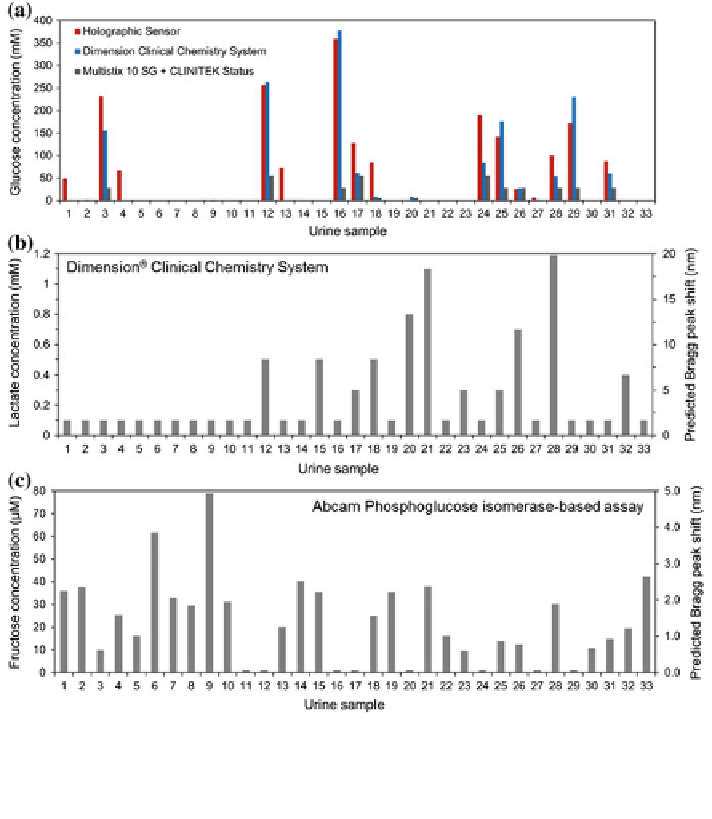
Fig. 5.19 Readouts for glucose, lactate and fructose concentrations in urinalysis. Measurements
of a glucose, b lactate and c fructose concentrations in urine samples. The secondary axis shows
the predicted Bragg peak shifts from the holographic sensor measurements in artificial urine. Data
points represent individual urine specimens (n = 33)
Clinical Chemistry System and the holographic sensor. Figure
5.19
a shows the data
points obtained from the holographic sensor, Multistix
®
10 SG strips with CLIN-
ITEK Status
®
+ Analyzer and Dimension
®
Clinical Chemistry System.
5.8 Lactate and Fructose Interference
The lactate assay is based on a modi
ed Marbach and Weil method [
57
], which
employs the oxidation of lactate to pyruvate, and its analytical sensitivity is
<0.3 mmol/L. Rabbit muscle lactate dehydrogenase (LDH) catalyses the oxidation