Chemistry Reference
In-Depth Information
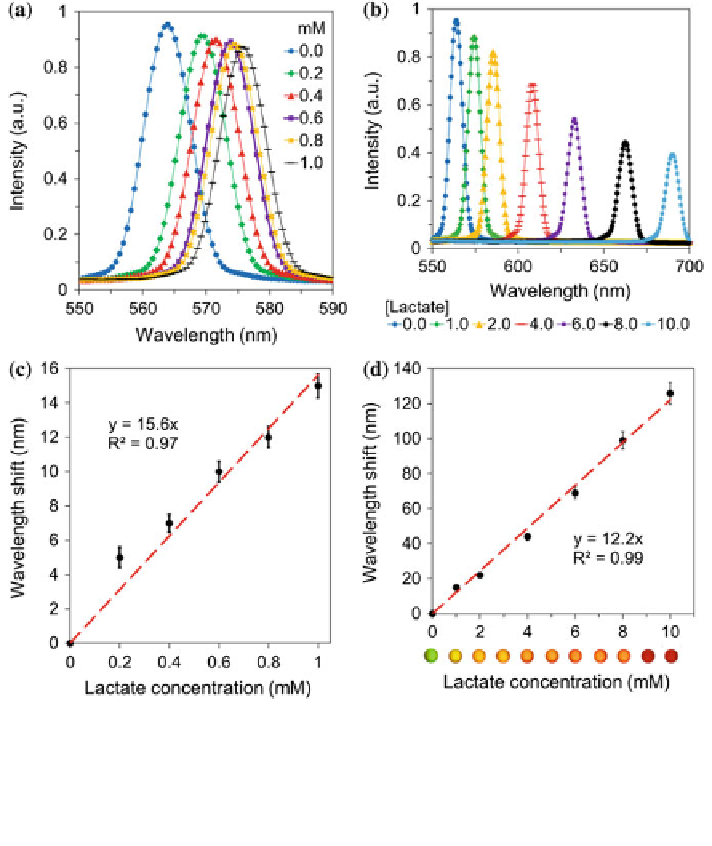
Fig. 5.11 Holographic sensor (20 mol% 3-APB) response to variation in the concentration of
lactate at 24
°
C in arti
cial urine. a, c An increase in the concentration (10.0 mM) of lactate in
arti
cial urine (pH 7.40) shifted the Bragg peak from
*
563 to
*
689 nm, b, d Lower lactate
concentrations (0.0
-
10.0 mM) shifted the peak from
*
563 to
*
578 nm (see upper inset) (n = 39).
The lower inset shows the colorimetric readouts. Standard error bars represent three independent
samples. Reprinted with permission from [
29
] Copyright 2014 The American Chemical Society
with boronic acid groups in the hydrogel. While at low concentrations (<1.0 mM)
of lactate, a Bragg peak shift of
15 nm was measured (Fig.
5.11
a), at high
concentrations (10.0 mM), a shift of
*
125 nm was measured (Fig.
5.11
b).
Figure
5.11
c, d shows the readouts over three trials, and the lower inset
*
in
Fig.
5.11
d illustrates the colorimetric response. At
lactate concentrations of
1.0 mM in urine [
7
], the corresponding interference of lactate shifts the Bragg
peak by 15 nm. The measurement errors due to lactate interference for the diagnosis
of glucosuria (10.0 mM) and urinary tract infections (<1.0 mM) were
*
4.2 and
*
13.6 %, respectively.
*