Chemistry Reference
In-Depth Information
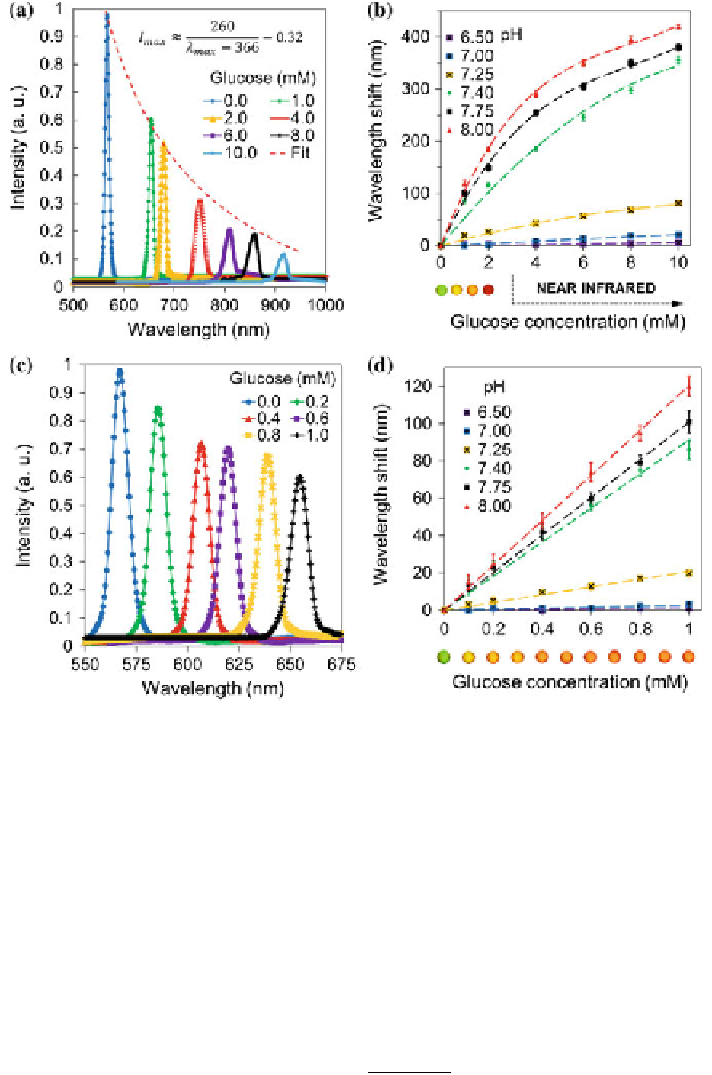
Fig. 5.10 The response the holographic sensor (20 mol% 3-APB) to variation in the concentration
of glucose below 1.0 and 10.0 mM in arti
cial urine at 24
°
C. a An increase in the glucose
concentration of arti
cial urine solutions (pH 7.40, 24
C) swelled the poly(AAm-co-3-APB)
matrix, thus red shifting the Bragg peak, while also showing a correlation between the intensity
and the wavelength measured (n = 7). Constants for the
t: c = 260 nm,
°
ʻ
0
= 366 nm, I
0
= 0.32,
and a.u. = arbitrary units. b Spectral readout at pH values from 6.50
8.00 (n = 126). The inset
shows the colorimetric response at pH 7.40. c A typical sensor response to variation in glucose
concentrations <1.0 mM. d The Bragg peak shift as a function of glucose concentration <1.0 mM
shows reproducibility (
±
*
5 nm) over three trials. The inset shows the colorimetric response at pH
7.40. Standard error bars represent three independent samples. Reprinted with permission from
[
29
] Copyright 2014 The American Chemical Society
-
(AAm-co-3-APB) matrix, where the expansion was
finite and the asymptotes did
not approach zero; the maximum intensity (I
max
) at a given
ʻ
max
:
c
k
max
k
0
I
max
I
0
þ
ð
5
1
Þ
: