Chemistry Reference
In-Depth Information
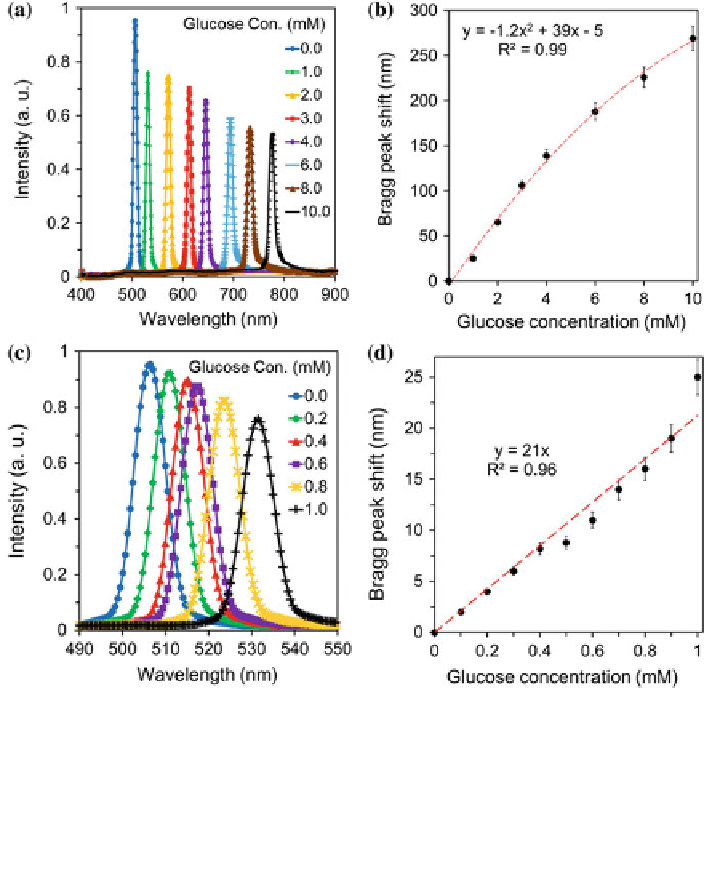
Fig. 5.7 Readouts of a holographic sensor due to variation in the concentration of glucose.
a Diffraction spectra of a holographic sensor swollen by different glucose concentrations in
phosphate buffers (pH = 7.4, IS = 150 mM, 24
C). The largest Bragg peak shift is at 775 nm
(10.0 mM glucose) and the smallest is at 505 nm (glucose-free). b The Bragg peak shift due to
10.0 mM glucose as a function of glucose concentration over three trials, c Bragg peak shifts of a
holographic sensor swollen by contact with different glucose concentrations <1 mM over the
physiological range, d The Bragg peak shifts over three trials as a function of glucose
concentration <1.0 mM. Standard error bars represent three independent glucose samples
°
systematically shifted from 505 to 775 nm (Fig.
5.7
a). As the hologram expanded
normal to the underlying substrate, the diffraction ef
ciency of the peaks decreased.
This behaviour can be attributed to the decrease in the density of Ag
0
NPs present
in the periodic regions of the hologram, which reduces the effective index contrast
between the patterned regions and the poly(AAm-co-3-APB) matrix. The Bragg
peak shift over three trials as a function of glucose concentration is shown in
Fig.
5.7
b. The sensing mechanism was reversible; the Bragg peak shifted to shorter
wavelengths as the glucose concentration was decreased. During the readouts, the
sample solutions were kept at 24
°
C, and agitated using a magnetic stirring bar