Database Reference
In-Depth Information
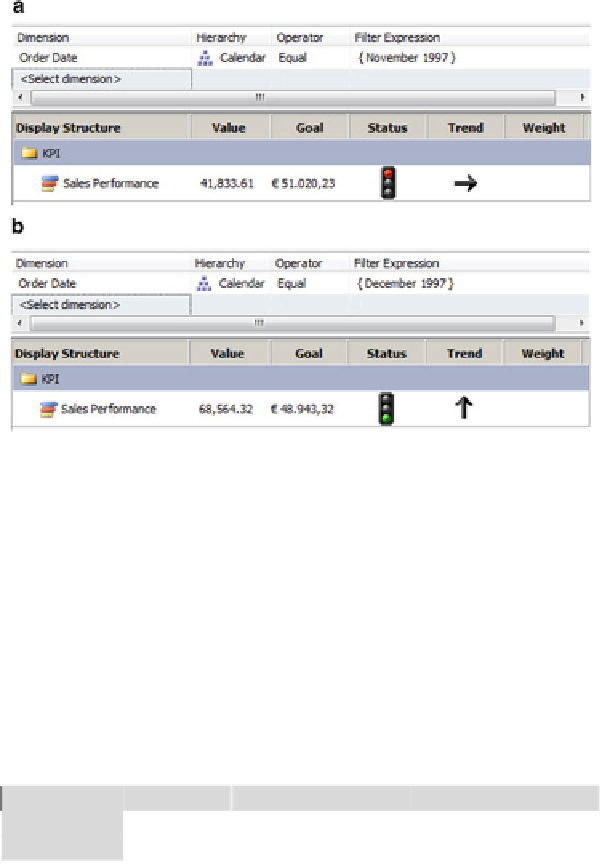
Fig. 9.14
Display of the
Sales Performance
KPI for November 1997 (
a
) and December
1997 (
b
)
Now that the KPI is defined, we can address the following MDX query to
the Northwind cube:
SELECT
{
Measures.[Sales Amount], Measures.[Sales Performance Goal],
Measures.[Sales Performance Trend]
}
ON COLUMNS,
{
[Order Date].Calendar.Month.[November 1997],
[Order Date].Calendar.Month.[December 1997]
}
ON ROWS
FROM Sales
The result is given next.
Sales Amount Sales Performance Goal Sales Performance Trend
November 1997
$41,833.61
$51.020,23
0
December 1997
$68,564.32
$48.943,32
1
Figure
9.14
shows the KPI for November and December 1997. As can be
seen, where the figures for the month of December achieved the goal, this
was not the case for the month of November.
9.3 Dashboards
The most popular visualization tools in business intelligence are
dashboards
,
which are collections of multiple visual components (such as charts or KPIs)
on a single view. Dashboards enable organizations to effectively measure,


Search WWH ::

Custom Search