Database Reference
In-Depth Information
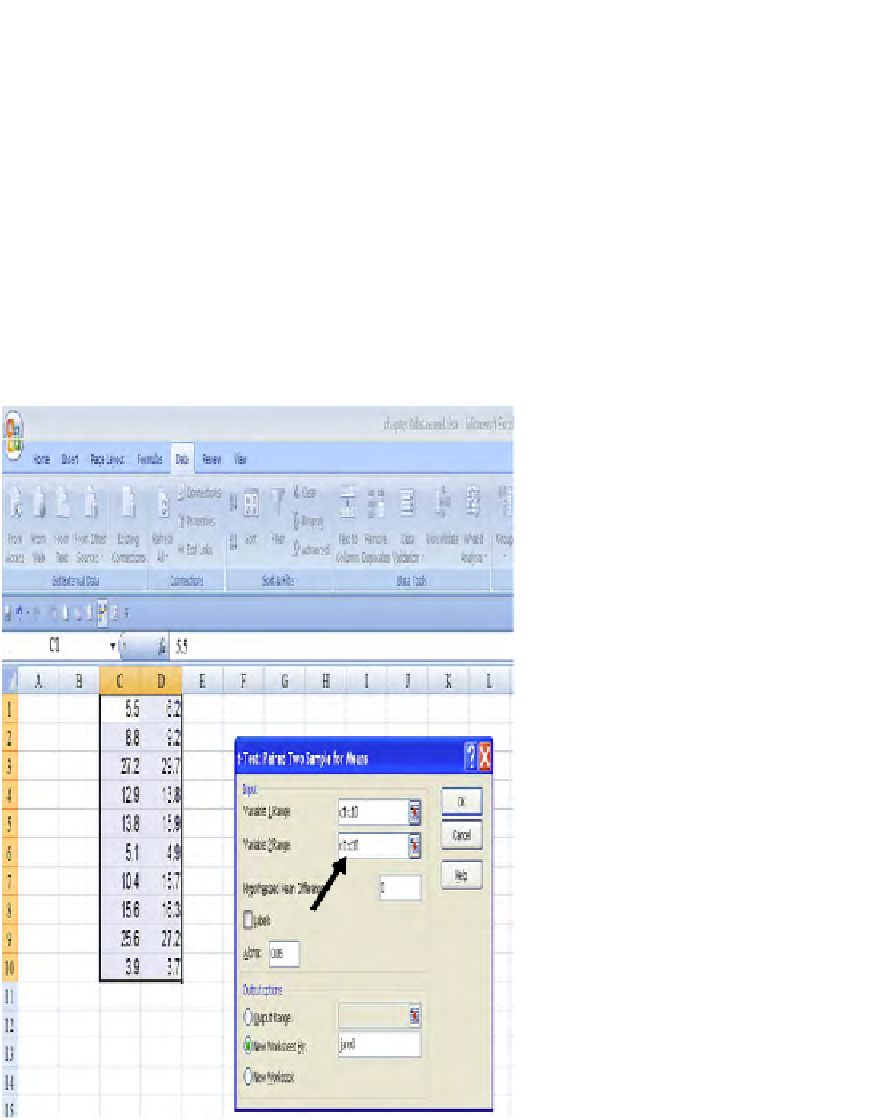
We click on the command and enter the location of each column of data (see
arrows in
Figure 3.2
).
We continue to choose to ask for the analysis to appear on a new page (here,
arbitrarily named “jared.” See next to the last row in
Figure 3.2
: New Worksheet Ply).
After clicking “OK” in
Figure 3.2
, we obtain our output in
Figure 3.3
.
In examining the
Figure 3.3
output, we see that the two-sided
p
-value is 0.0262,
certainly less than the traditional α = 0.05 (see arrow in
Figure 3.3
).
Thus, we reject H0, and, beyond a reasonable doubt, we conclude that there is a
difference in mean time to post a job between the two designs; design 1 (“The Long
Scroller”) requires less time than design 2 (“The Wizard”).
In other words, if the means for the two designs were the same after we magically
tested with everyone on Earth, a difference in means that large (14.26 − 12.88 = 1.38)
FIGURE 3.2
Entering the location of the two columns of data; Excel.


Search WWH ::

Custom Search