Database Reference
In-Depth Information
Design1:0
.
45−4
.
55
Design2:3
.
45−7
.
55
And we can see that, indeed, the two conidence intervals overlap and not just
by a tad—there is an overlap of 3.45-4.55. So, you may be prone to accept H0 and
conclude that the
true means cannot be said to be different
.
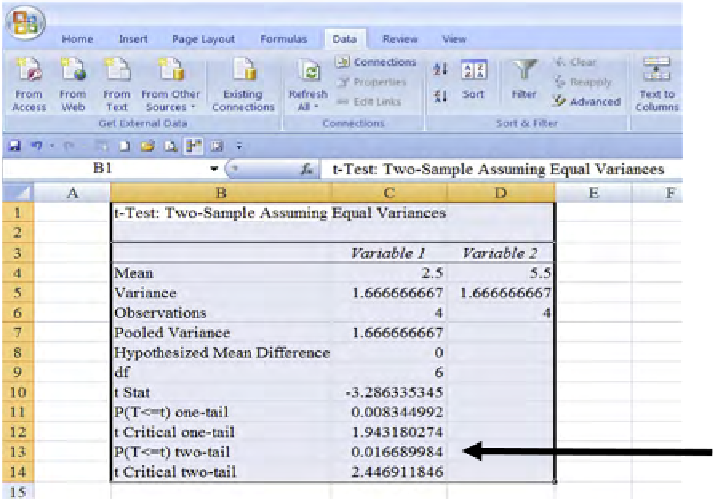
However, when we perform the t-test for two independent samples, testing:
H0:μ1=μ2
,
H1:μ1≠μ2
.
We get the output in
Figure 2.12
from Excel; it would be the same exact results
if we used SPSS.
We can see that the (two-sided)
p
-value is 0.0167 (see arrow in
Figure 2.12
), well
below the traditional 0.05 cutoff point (and recall—a 0.05 cutoff point corresponds
with a 95% conidence interval), and thus, based on this output, we would reject H0
(and, it's not even close!!), and conclude that
there is a difference in the true means
for two designs
.
So, the above example clearly demonstrates that “eyeballing” overlapping con-
idence intervals and declaring means the same is playing with ire. You've been
warned!
ſ
FIGURE 2.12
t-test for comparison with conidence interval results.


Search WWH ::

Custom Search