Database Reference
In-Depth Information
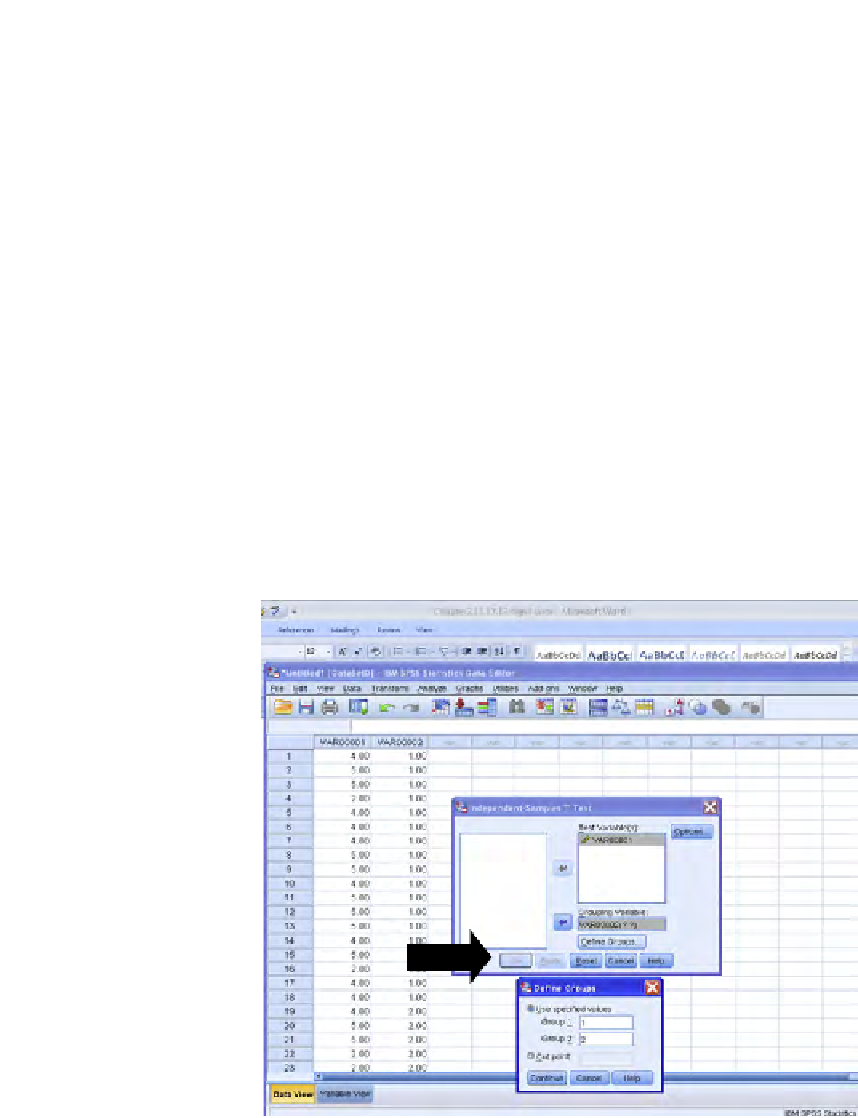
(column 2) to the “Grouping Variable” box (the variable that represents the different
usability approaches being tested).
Next, click the “Deine Group” button (see long arrow in
Figure 2.10
), which will
open the “Deine Groups” dialog box. Within that dialog box, type in a “1” and a “2”
to relect what we have called the two groups (i.e., designs)—see dashed arrow in
Figure 2.10
. We called them, indeed, “1” and “2.”
Now click on the “Continue” button (curved arrow in
Figure 2.10
). The question
marks next to “design—VAR000002” in the Grouping Variable box will become “1”
and “2,” the Deine Groups box disappears, and we are almost done. Back on the
original dialog box, just click the “OK” button (see thick arrow in
Figure 2.10
). Now,
we see the output in
Figure 2.11
.
There are several things noteworthy about the SPSS output, even though we natu-
rally get the same answer as obtained doing the analysis with Excel.
First of all, the SPSS output performs a Levene test (left side of output, circled
in
Figure 2.11
) to determine whether the appropriate test should be the one which
assumes equal variances or the one that does not assume it (n.b., SPSS labels the lat-
ter correctly, as “equal variances not assumed.”). In this case, the Levene test
p
-value
is 0.046 (recall that SPSS refers to “
p
-value” as “Sig.”), which is under 0.05, indi-
cating that we reject that variances are equal and should, thus, go with the test that
FIGURE 2.10
Details of running the test.


Search WWH ::

Custom Search