Database Reference
In-Depth Information
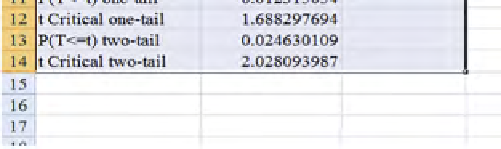
FIGURE 2.5
Excel output.
We now examine this output in
Figure 2.5
. The key value on the output is the
“
p
-value” for a two-tailed test. We discussed “
p
-value” and its importance at length
in Chapter 1. Indeed, “
p
-value says it all” was the “mantra” we wished to impart, and
we see that again here. And the test was two-tailed—that is automatic, as discussed
earlier, whenever the hypothesis test is an “=” versus “≠.”
We repeat what we noted in Chapter 1—the “
p
-value says it all” refrain pertains
only to whether we accept or reject H0. And, nobody would deny that the software's
giving us the
p
-value greatly simpliies the accept/reject H0 decision. However, we
agree that the
p
-value does not speak to the
practical signiicance
of the results.
When the sample size is large, one can often get a signiicant statistical result without
any practical signiicance. However, as we noted, most studies in UX involve rela-
tively small sample sizes, and when a result is signiicant when using a relatively
small sample size, far more often than not it has practical signiicance also.
In this output, Excel calls the
p
-value by “P(
T
< =
t
) two-tail.” See arrow in
Figure 2.5
. And, we see that the value is 0.0246. This is below 0.05, the traditional
standard for signiicance, so we reject H0 and go with H1, and thus conclude that
there is suficient evidence to be convinced that the true mean sophistication ratings
of the two designs are different
.


Search WWH ::

Custom Search