Database Reference
In-Depth Information
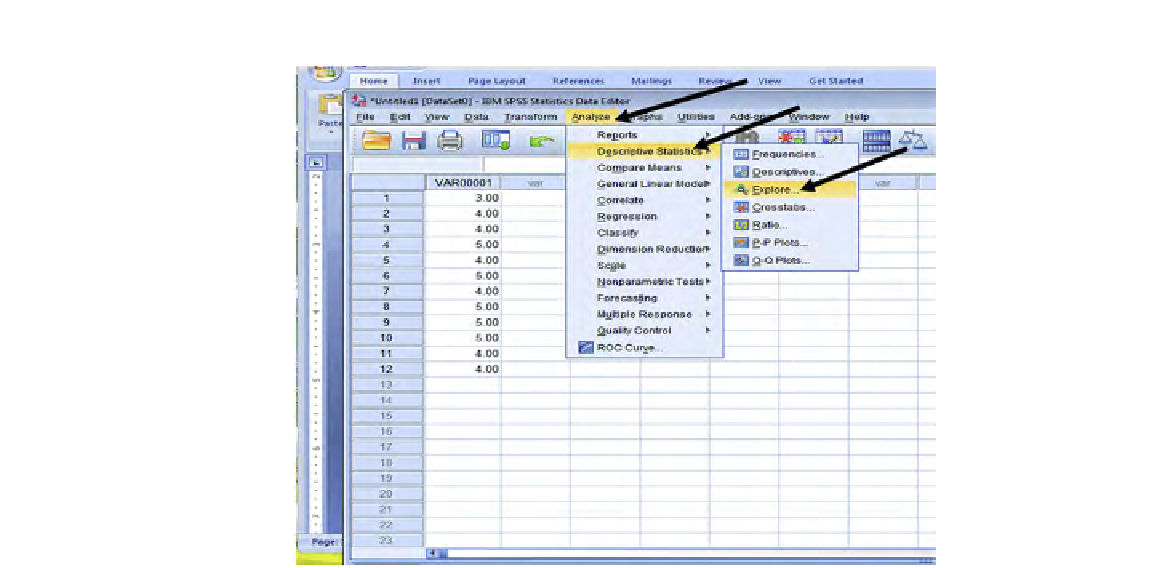
FIGURE 1.16
SPSS after analyze, descriptive statistics, and explore.
Now, to operate on VAR00001, we highlight it in the left large rectangle (it's
highlighted in
Figure 1.17
) and click the arrow next to the Dependent Variable rect-
angle, which drags VAR00001 into that box. See
Figure 1.18
, and notice how the
arrow, which was pointed toward the Dependent Variable rectangle (indicating some-
thing needs to go there), is now pointing away from it. (Perhaps later you will wish to
replace VAR00001 [highlight it and click arrow to place it back to the list of variables
on the left] by some other variable.)
3
In our current situation, all we need to do now is to click the OK box (notice—no
longer grayed out!!) Doing so produces the output in
Figure 1.19
.
3
Actually, if you had two variables and wished to ind a conidence interval for both of them, you would
not have to do them separately, but would drag both variables into the Dependent Variable rectangle
and receive output results for both variables in one overall output box.

Search WWH ::

Custom Search