Database Reference
In-Depth Information
To ind a conidence interval for the true (population) mean, we click on Data
Analysis, and then highlight Descriptive Statistics and click “OK.” See arrows in
Figure 1.10
.
This provides us with another box, into which we enter the required information—
the data we want analyzed. (Indeed, Excel, as good as it is, is not a mind reader!) See
Figure 1.11
.
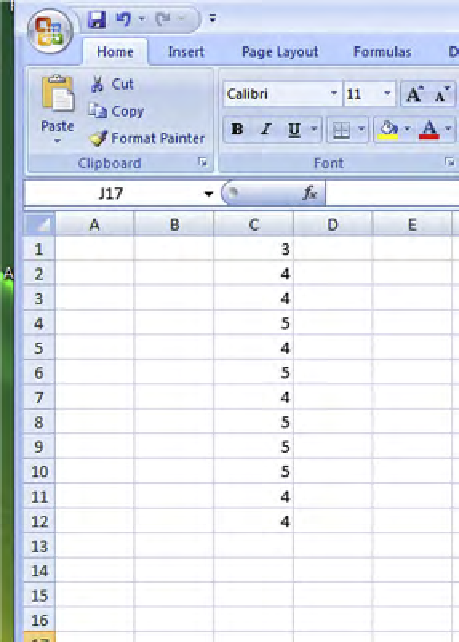
We now ill in where the data values are in the “input range” section, C1 to C12,
(see fat vertical arrow in
Figure 1.12
), and we check off “Summary Statistics” and
“Conidence Interval for Mean” (which has a default of 95% (although, of course, this
conidence level is changeable), conirming what we indicated before, that, tradition-
ally, 95% is the choice used very often in industry); see the two horizontal arrows in
Figure 1.12
. Finally, (see dashed arrow in
Figure 1.12
) we ill in “New Worksheet Ply”
by an arbitrary name—Wolf. We always prefer to get the analysis results on a separate
worksheet (i.e., page)—just to ensure the results are not mixed up with our data!
FIGURE 1.9
Illustrative data for determining a conidence interval.

Search WWH ::

Custom Search