Database Reference
In-Depth Information
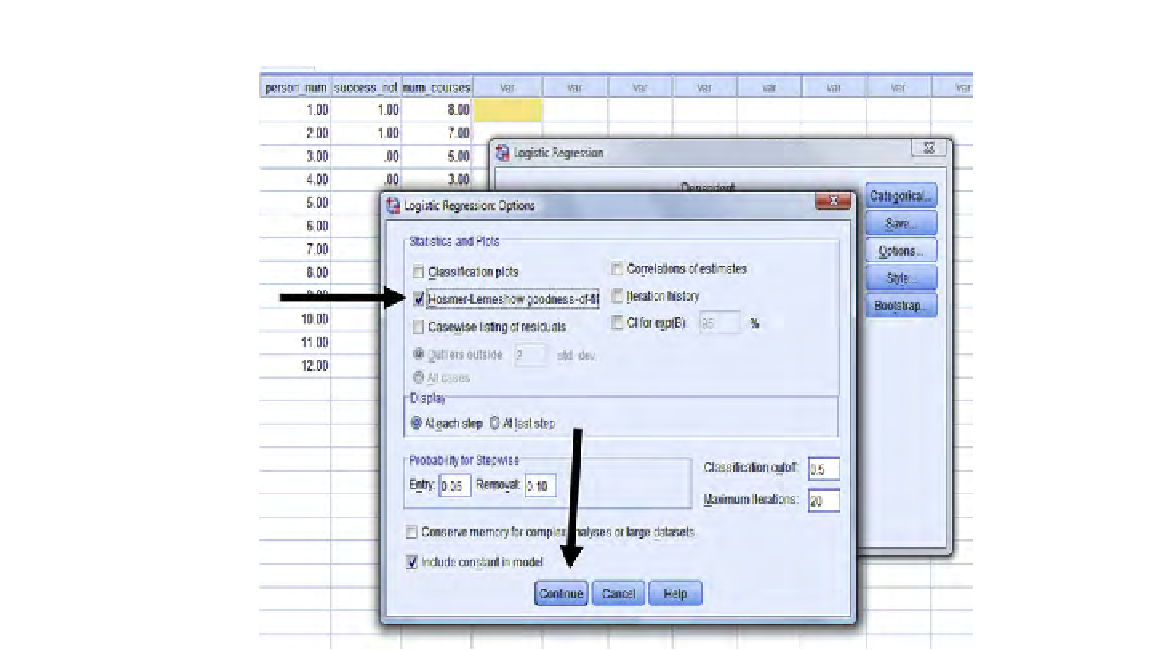
FIGURE 11.8
The Logistic Regression: Options dialog box; SPSS with illustrative example.
FIGURE 11.9
The Hosmer and Lemeshow test output; SPSS with illustrative example.
be very tedious, and likely unworkable for a large data set. Luckily, we can simply
ask SPSS to ind the predicted value for all of the X's.
If you go back to
Figure 11.2
, you see that it is our irst igure for this numerical
example and consists of the two key columns of data, “success_not” (the Y variable)
and “num_courses” (the X variable), as well as a column not used formally in the
analysis, “person_num.”
Now, refer back to
Figure 11.7
for reference. This time, instead of clicking on the
“Options” button, click on “Save” (see oval in
Figure 11.10
). This results in display-
ing the “Logistic Regression: Save” dialog box shown in
Figure 11.10
(see horizontal
arrow in
Figure 11.10
).


Search WWH ::

Custom Search