Database Reference
In-Depth Information
SIDEBAR: COX, SNELL, NAGELKERKE: WHO ARE THESE GUYS ANYWAY?
We are familiar with the r
2
in regular linear regression; it indicates our estimate of the proportion of
variability in Y accounted for by X (or the X's in multiple linear regression). But, when the Y variable
is categorical, we cannot compute an r
2
value that has the same meaning. So, there are approximation
methods used to compute this proportion of variability. We'll go over the most common here.
Perhaps the most well known is the Cox and Snell
R
-square. It can be extremely useful, but
there's a caveat: Its maximum value is 0.75 with a categorical Y (as we have in our example).
The other SPSS
R
-square measure for a categorical Y is the Nagelkerke
R
-square. This is an
adjusted version of the Cox and Snell
R
-square that expands the range to be 0 to 1. Of course, just
like when examining an r
2
for regular linear regression, we cannot clearly deine what is a high
value for these pseudo-
R
-square values. As we noted in Chapter 9, it depends on the speciic appli-
cation. We conclude discussion of this section of the output by stating that for you, the UX person,
this is likely the least important of the three sections of output, a fact that differs from the usual case
in regular linear regression.
In terms of a hypothesis test that is easy to understand and somewhat in the spirit of an F-test,
we recommend the Hosmer-Lemeshow test, which is exempliied later.
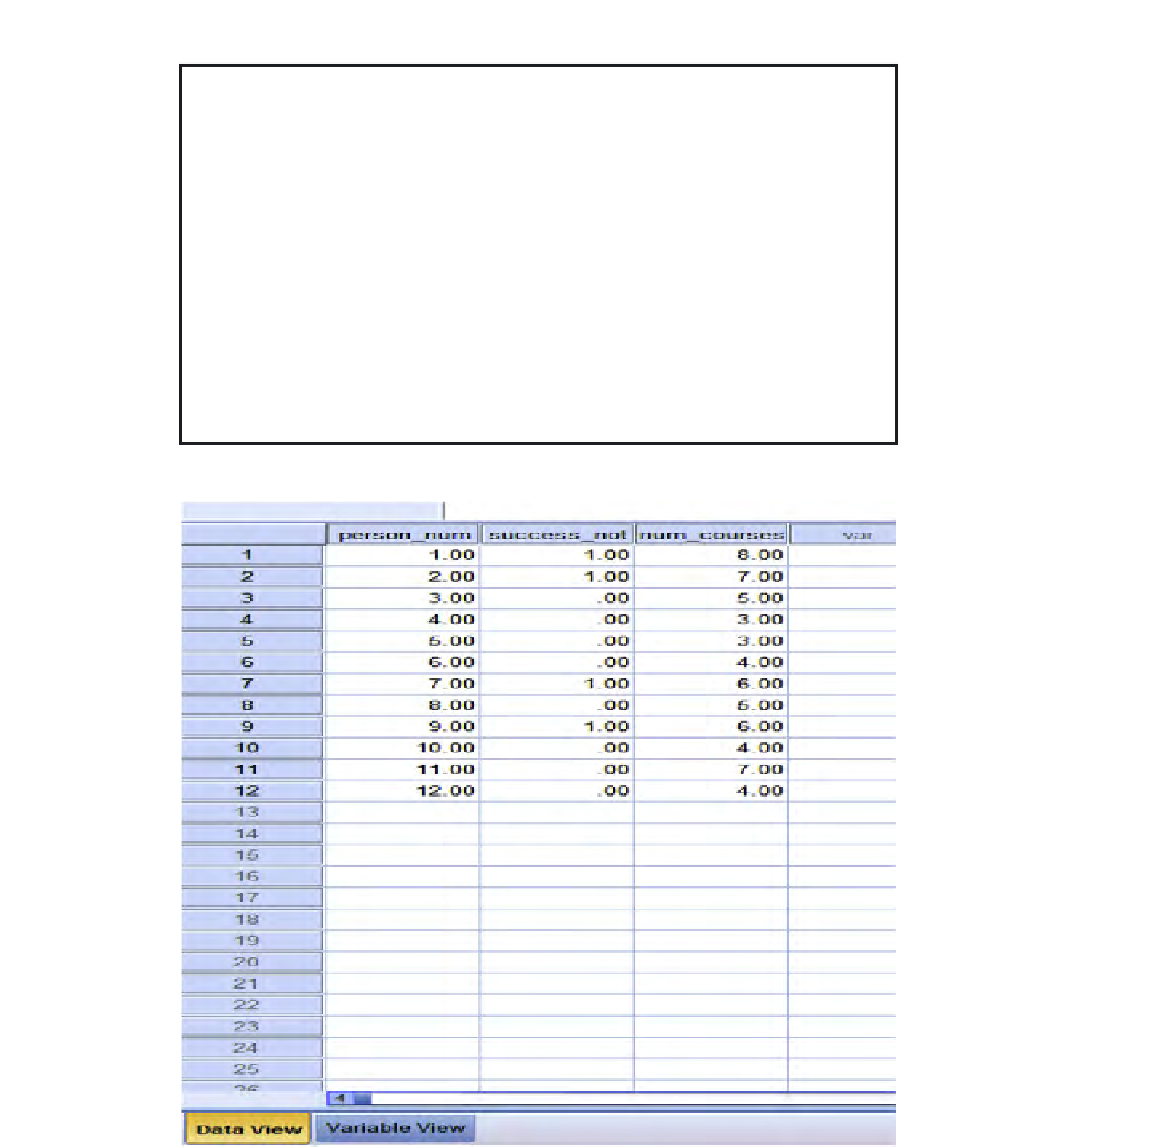
FIGURE 11.2
Data entered into SPSS; illustrative example.
Search WWH ::

Custom Search