Database Reference
In-Depth Information
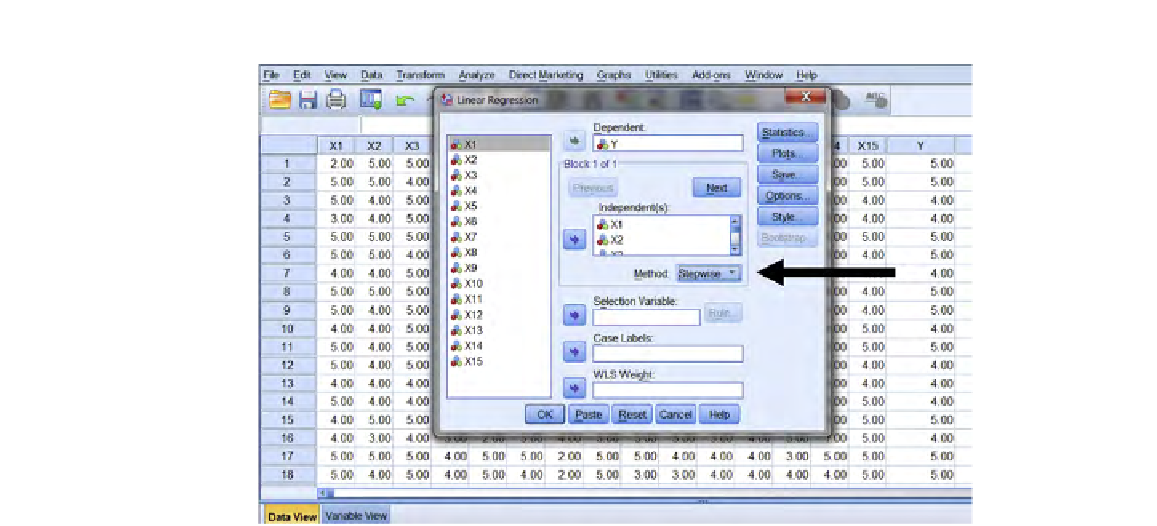
FIGURE 10.15
Linear regression
method
changed to
Stepwise
; SPSS with Behemoth.com.
Click on “Stepwise,” and it will appear in the “Method” box, as shown by the
arrow in
Figure 10.15
.
We now click OK in
Figure 10.15
, arriving at the output in
Figure 10.16
. We do
not present the entire output
, but only the sections we believe are useful to you.
As we examine the output, the top section traces through how the stepwise pro-
cess proceeded. Signiicant variables were entered into the equation in the order X15,
X7, X11, X1, X3, X2, X6 (the same 7 X's that earlier comprised “the big 7” were
signiicant) and the
r
2
values increased at each step from 0.202 (a value we have seen
before, the
r
2
between Y and X15 [ability to perform a Boolean search]), up to 0.469
(see the circled
r
2
values in the top section of
Figure 10.16
). Recall that variables 1,
2, 3, 6, 7, 11, and 15 are, respectively:
Ability to search by job title
Ability to search by years of experience
Ability to search by location
Ability to search candidates by level of education
Ability to search by skills
Ability to search candidates by companies in which they have worked
Ability to perform a Boolean search
Now, the bottom section tells you the equation at each step. However, it is really
only the last step that counts!! We can see that the equation of the last step is (see the
rectangle in the lower section of
Figure 10.16
):
Search WWH ::

Custom Search