Database Reference
In-Depth Information
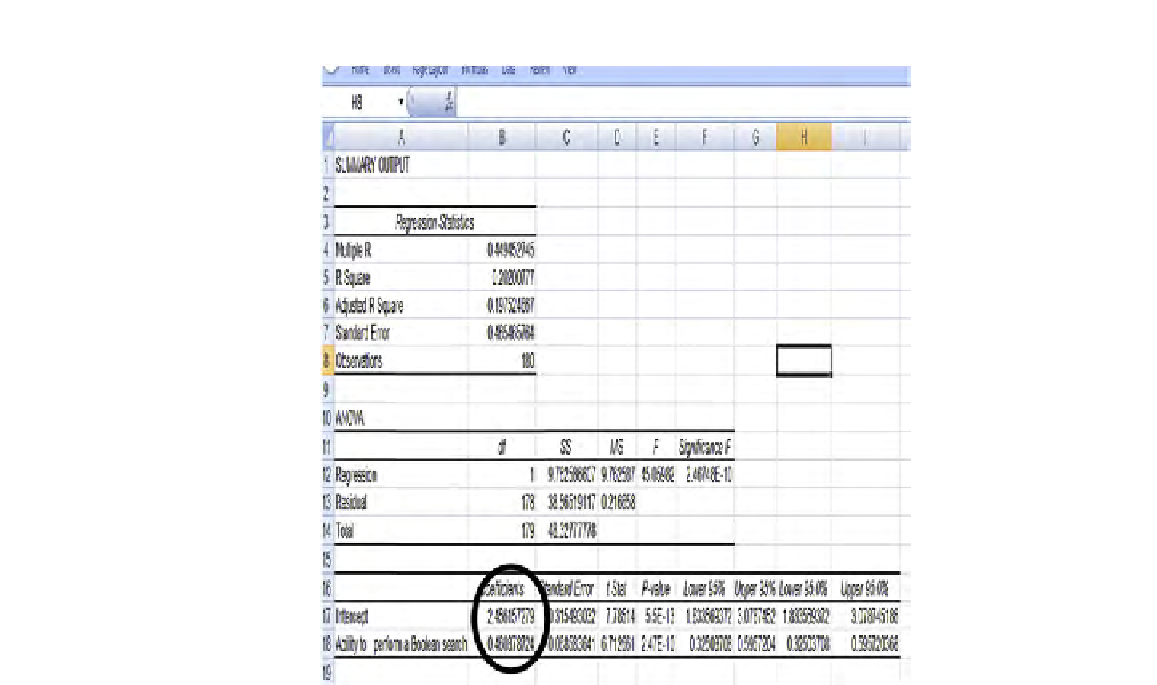
FIGURE 9.27
Linear regression output for Behemoth.com data; Excel.
(i.e., high) for just one X variable, there is still 80% of the variability (1−r
2
= 0.8)
unaccounted for.
The
p
-value of the slope is 0.000; thus, the slope is highly signiicant; remem-
ber that the value “2.47E-10” actually means 0.000000000247 as the notation
indicates that we should move the decimal point 10 places to the left. It is, of
course, the same
p
-value we found much earlier when we analyzed the correla-
tion. This very low
p
-value indicates that there is virtually no doubt that there is a
positive linear relationship between the
usefulness of the Ability to do a Boolean
search, and the Likelihood of Adoption of the search engine. Furthermore, the
r-square value of 0.202 means we estimate that the former,
by itself
, explains
more than 20% of the responder's choice for the Likelihood of Adoption of the
search engine query.
The results are the same, of course, in SPSS. See
Figure 9.28
.
Search WWH ::

Custom Search