Database Reference
In-Depth Information
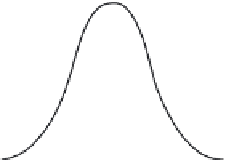
X
µ
=
160, 190
σ
= 20
FIGURE 1.4
A depiction of the area under a normal curve.
which tells the user the probability that the result is less than X, when the mean
and standard deviation are the values they are. The “1” in the last position is simply
always a “1” and is there for technical reasons that need not concern us—in a sense
the “1” is simply indicating a “left-tail cumulative.” (See the “How Many Tails”
sidebar in
Section 1.4
.) We denote this as:
=P(result< [specificvalueof] X).
Filling in the actual values, the formula in our current scenario becomes:
=NORMDIST(190
,
160
,
20
,
1),
In our example, we have both the command above and the answer, depicted in the
Excel spreadsheets in
Figures 1.5 and 1.6
, in a random cell (J7).
FIGURE 1.5
Excel spreadsheet showing the command in cell J7 for inding the area under the normal
curve in
Figure 1.4
.


Search WWH ::

Custom Search