Database Reference
In-Depth Information
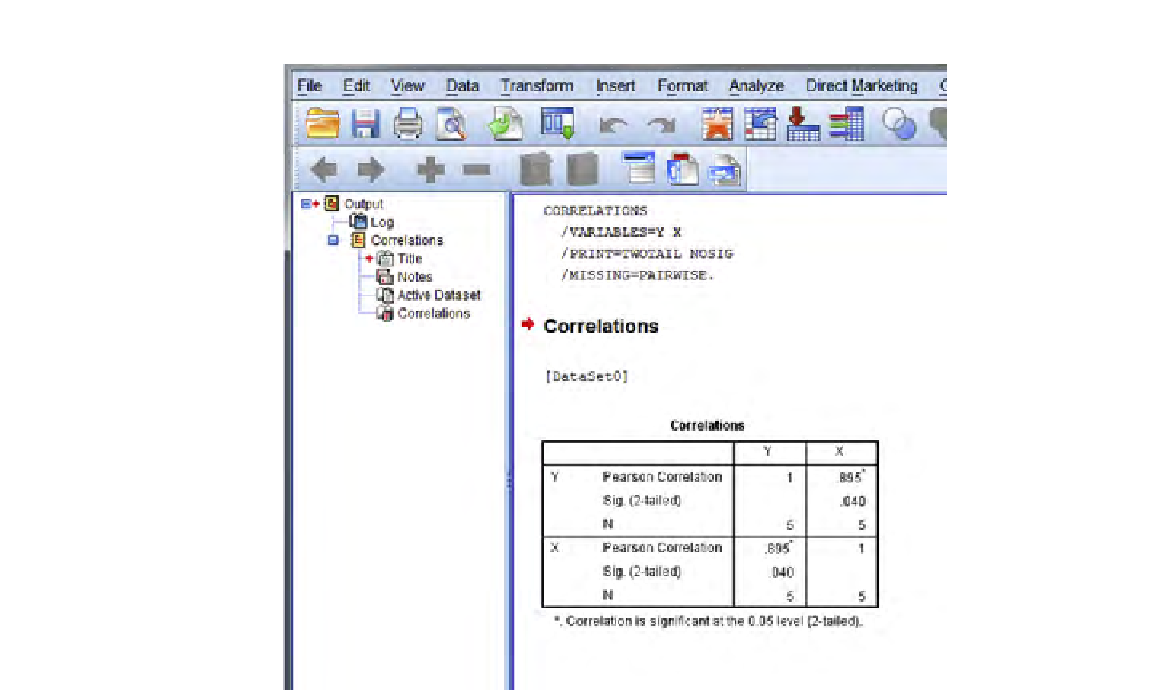
FIGURE 9.9
Correlation output; SPSS with illustrative data.
As a consequence, two of the columns of data you collected during the unmod-
erated usability test were the Likelihood of adoption (of the search engine) and the
assessed usefulness of the Ability to perform a Boolean search, each rated on a 1-5
Likert scale, as mentioned earlier.
Therefore, we have 180 rows of data for these two variables (as we do for all of
the data).
Figure 9.10
displays the irst 26 rows of data in Excel. Also, we should take
note of the fact that the irst row on the spreadsheet is taken up with the column labels.
As we noted, there are 180 data values in rows 2-181. When we open “Data
Analysis” and then “Correlation,” we have what is shown in
Figure 9.11
.
We show you
Figure 9.11
speciically since it illustrates the use of a column
label (i.e., title). Note how we entered the location of the input data: A1-B181,
since there are 180 rows of data. We then check the box that asks whether we have
a label in row 1. We do, and thus, we check that box; see arrow in
Figure 9.11
.
Excel now knows to consider rows 2-181 as actual data rows.
Search WWH ::

Custom Search