Database Reference
In-Depth Information
9.3
THE CORRELATION COEFFICIENT
The “correlation coeficient” relects the relationship between two variables. Specii-
cally, it measures the strength of a straight-line relationship between two variables,
and also tells you the direction of the relationship, if any. It is a numerical value that
ranges between −1 and +1 and is typically denoted by “r”:
−1 ≤ r ≤+1
The absolute value of the correlation relects the strength of the relationship. So,
a correlation of −0.80 indicates a stronger relationship than +0.70.
There is an arithmetic formula to compute the correlation coeficient, but you
should simply use Excel or SPSS to compute it for you. (We will show you how to
do this later in this section.)
Let's irst consider a small example before we dive into the Behemoth.com data
set. Say that we have two variables: (1) Assessment of how sophisticated a Web
design is, and (2) Amount of experience buying products online. We will assign the
sophistication assessment as the output variable, “Y,” and the amount of experience
as the input variable, “X.” It is common to use Y to notate the output variable and X
to notate the input variable.
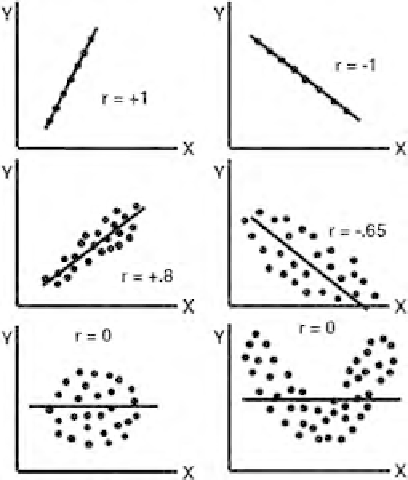
The correlation coeficient, “r,” measures the relative degree to which a straight
line its the data. Let's consider the six “scatter plots” in
Figure 9.1
, and discuss them
in light of the value of r.
FIGURE 9.1
Scatter plots of Y and X data.


Search WWH ::

Custom Search