Database Reference
In-Depth Information
However, there are two basic ways to tell the story of this interaction. Each
one uses the second deinition we alluded to earlier in the chapter. Simply put, the
description that is likely to make the most sense is this:
The effect of
age group
on the sophistication rating is not the same for each
gender
.
By way of supporting that statement, consider
Table 8.6
, which shows us the
mean sophistication rating for each age group/gender combination. In looking at
Table 8.6
, please remember that there are slightly more than twice as many females
(85) as males (41) in the study, so that the overall means are dictated quite heavily
by the female means.
We can see from
Table 8.6
that for the females, the general pattern indicated by
the S-N-K results holds, and, indeed, the general pattern of female means is consis-
tent with the overall means. You can see that the rank order of the female means is
the same as for the overall means.
However, for the males it differs. The youngest age group rated the sophistica-
tion very differently from the females and higher than age groups 4 and 5. That is a
reversal of the female pattern. This is what we meant by what we bolded a bit earlier
(which we repeat):
The effect of
age group
on sophistication rating is not the same for each
gender
.
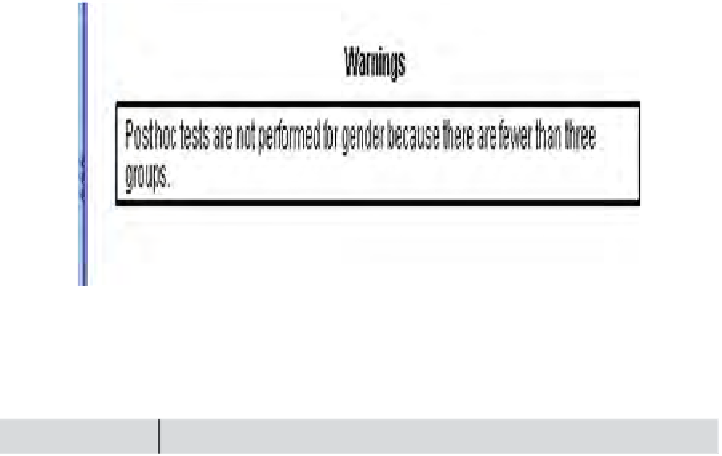
FIGURE 8.8
S-N-K “result” for gender; SPSS.
Table 8.6
Means for Each Age Group/Gender Combination and Overall
Age Group:
1-25
26-35
36-45
46-55
56-66
Male
3.20
4.00
3.71
2.55
2.11
Female
1.72
4.45
4.79
3.50
3.14
Overall
2.25
4.38
4.50
3.04
2.74


Search WWH ::

Custom Search