Database Reference
In-Depth Information
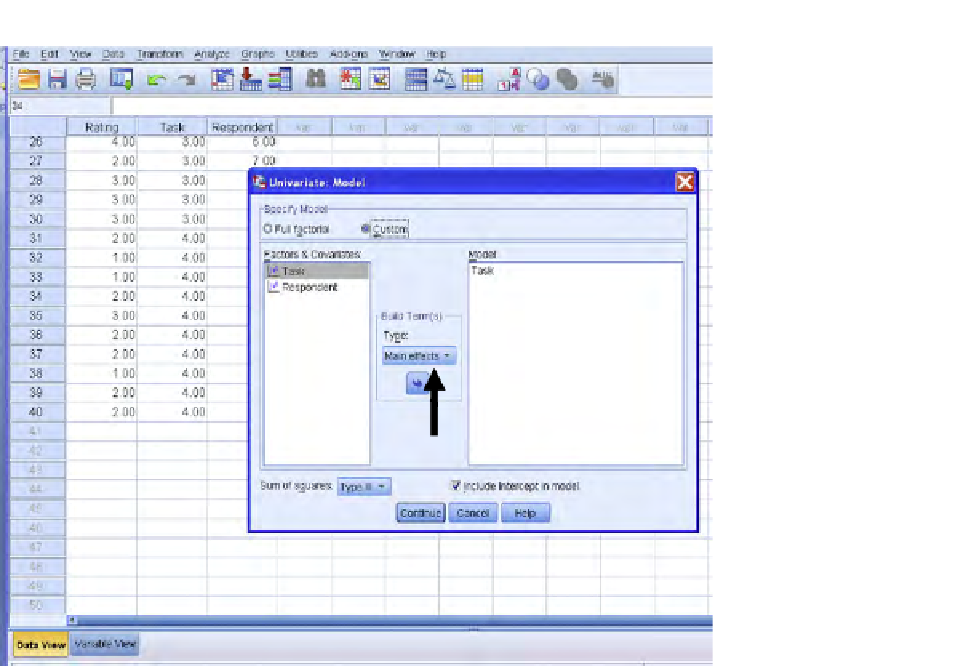
FIGURE 7.12
Clicking on Main Effects; SPSS.
will, in essence, duplicate the within-factor design illustrated in
Table 7.3
. There is a key
assumption being made when there is no replication, and that is there is no “interaction”
between the two factors. We describe “interaction” in great detail in the next chapter; for
now let us view the lack of interaction between the two factors as simply indicating that
the effects of the two factors are “additive”—that is, they combine in a way that simply
adds the effects together, without any “synergy.” Again, if this is a bit vague, please wait
until the next chapter in which we promise to make the ideas about interaction clear.
We illustrate our analysis using Excel and the aforementioned, “Anova: Two-
Factors without Replication.” In
Figure 7.13
, we present the data as it is entered onto
the Excel spread sheet, looking like the format in
Figure 7.3
. To recall: we have 10
people rating each of four tasks on the 1-5 Likert scale.
We now go to “Data Analysis” in Excel and down to “Anova: Two-Factor without
Replication.” See arrow in
Figure 7.14
.
After we click on that command, we then see the dialog box in
Figure 7.15
.
It can be noticed in
Figure 7.15
that the “Input Range” is illed in with B1:E10
(see vertical arrow in
Figure 7.15
), and we have arbitrarily asked that the output be
placed on a new worksheet named “susan.” See horizontal arrow in
Figure 7.15
.


Search WWH ::

Custom Search