Database Reference
In-Depth Information
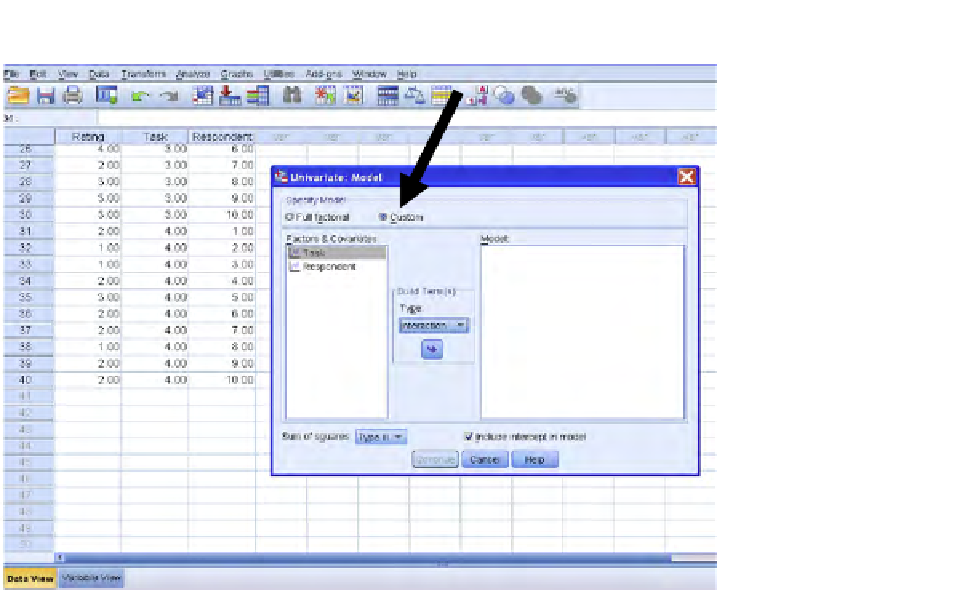
FIGURE 7.10
“Model” dialog box after clicking “custom;” SPSS.
1.
Click on “Task” on left, and “drag” it to the model box on the right (see it illus-
trated in
Figure 7.11
, by “fat arrow”).
2.
Look at “type” (see circle in
Figure 7.10
) and pull down the tab that says “Inter-
action” (inside of the circle), by clicking on it. This will produce
Figure 7.11
.
The third thing you must do is to click on “Main Effects” (see bent arrow in
Fig-
ure 7.11
), arriving at
Figure 7.12
(see vertical arrow in
Figure 7.12
), and then click
on Continue—see horizontal arrow in
Figure 7.12
.
After you click on Continue in
Figure 7.12
, you arrive back to
Figure 7.4
(or, equiv-
alently,
Figure 7.8
) and can now proceed as in Chapter 6 to perform the S-N-K test.
In the next chapter, Chapter 8, we are better equipped to tell you why we need to
do these extra steps in this within-subjects design situation.
7.7
EXCEL ANALYSIS
In general, when considering two factors, (bare bones)
Excel will perform the analysis
only if the two factors are ixed.
SPSS allows the factors to be either ixed or random.
However, when we have a within-subject design of the format of
Table 7.3
, we have what
is referred to as “no replication.” In this case, the analysis of variance (ANOVA) is the
same whether the row factor is ixed or random. Therefore, the Excel command “Anova:
Two-Factor Without Replication” (where one of the factors is “people” or “respondent”)


Search WWH ::

Custom Search