Database Reference
In-Depth Information
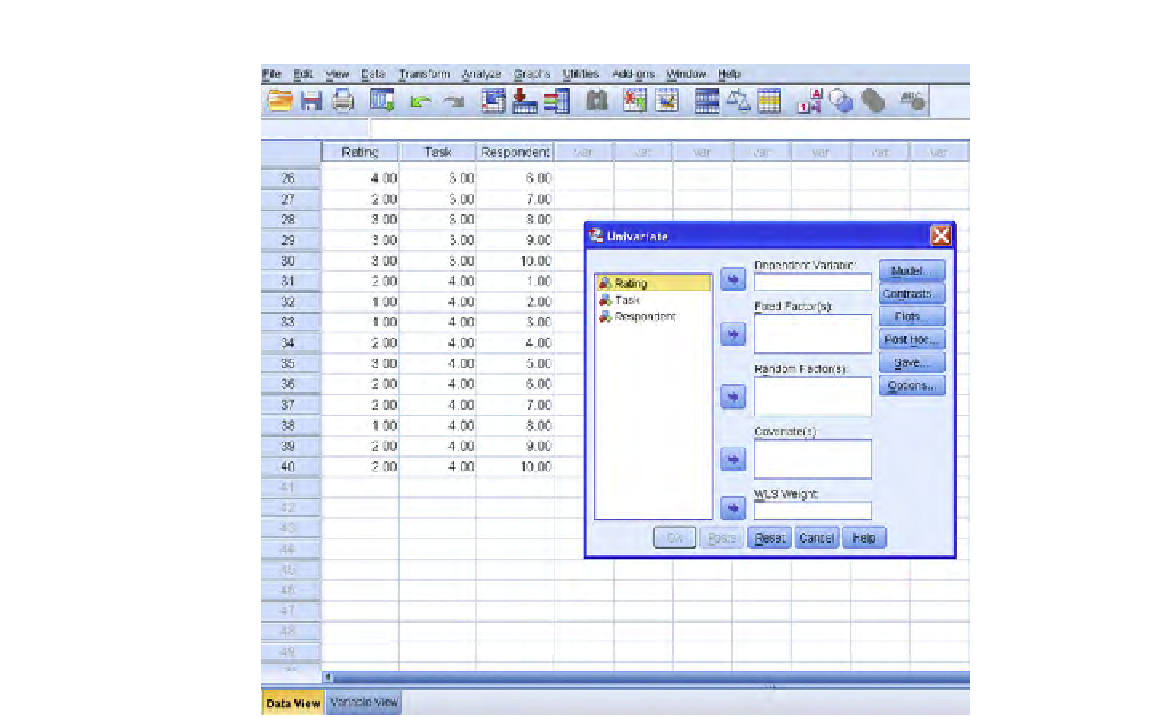
FIGURE 7.3
Univariate dialog box for one-factor ANOVA; SPSS.
The “Respondent” variable goes to the
random factor
box (horizontal arrow in
Figure 7.4
.)
We are now ready to click on “OK.”
The output is presented in
Figure 7.5
.
The key quantity is the
p
-value for “Task,” which is 0.000 in
Figure 7.5
(see
arrow). Recall that SPSS rounds all
p
-values to three digits.
So, the
p
-value for “task” is way below the 0.05 cutoff point, and we conclude
that the mean ease-of-use rating is
not
the same for the four tasks.
We might note that the
p
-value for “people” is 0.081 (see oval in
Figure 7.5
). This is
not below the 0.05 traditional cutoff point, indicating that we conclude that the mean for
each respondent
, averaged across all four tasks, cannot be said to be different (although
it is close—the
p
-value is not much above the 0.05 cutoff). This latter point is not of
prime interest to us, but it does indicate that we do not have enough evidence to refute
that the people, on average, are consistent in their evaluations of the ease-of-use of the
four tasks. Of course, this does not indicate directly that each person rates
every
task the
Search WWH ::

Custom Search