Database Reference
In-Depth Information
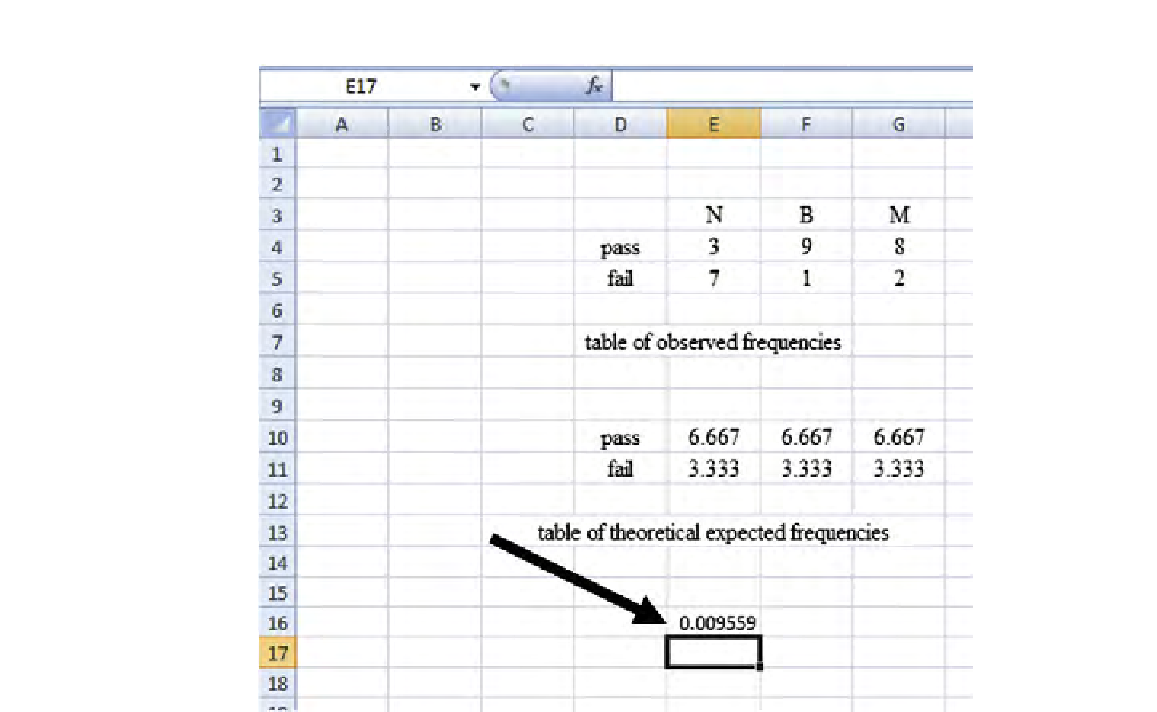
FIGURE 4.10
The
p
-value of the hypothesis test with three search engines; Excel.
pass rates cannot be said to differ between search engines B and M. This conclu-
sion is not based on the
p
-value itself (which simply indicates that we conclude
that all three values of
p
are not the same), but, rather, on a common sense look
at the pass rates. (If you wanted to be picky about it, you could test each search
engine against each other individual search engine, and you would reach the
same conclusion.)
4.8.2
SPSS
In SPSS, we enter the data in a way similar to
Figure 4.4
, except that we now have
30 rows, 10 for each search engine. We let M be denoted by “3” in the search engine
column. See
Figure 4.11
.
Search WWH ::

Custom Search