Database Reference
In-Depth Information
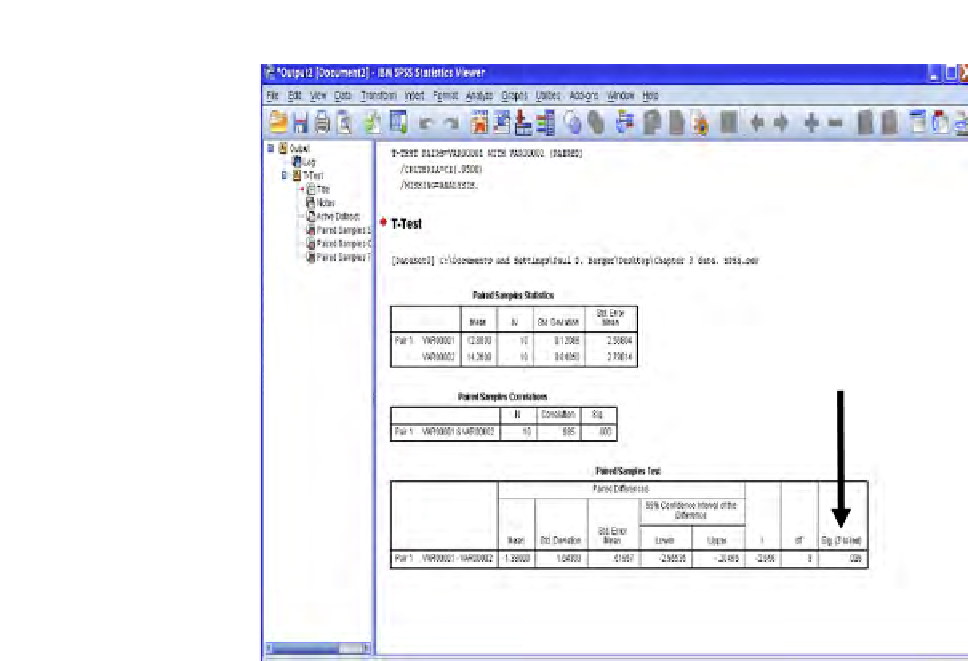
FIGURE 3.7
Output from SPSS.
variables (i.e., another comparison), another row pops up as an opportunity to add yet
another set of two variables to be compared.
After we go click on “OK,” we get our output in
Figure 3.7
.
The output gives us the same result as we got from the Excel output. The “T-stat”
(just “t” in the SPSS output above) is identical. The
p
-value (as we know, “sig.”
in SPSS—see arrow in
Figure 3.7
) is 0.026, which is below α = 0.05, so we reject
H0 and conclude that there is a difference in the mean time it takes to post the job
between the two designs. That is, we conclude that the “Long Scroller” is faster.
3.5
BEHEMOTH.COM REVISITED
As quickly as you can, you write up your usability test indings: demographics,
methodology, high-level indings, usability issues found, self-reported metrics, and
of course, recommendations. Most importantly, you cut and paste the SPSS output
into the report, circling the
p
-value.


Search WWH ::

Custom Search