Geology Reference
In-Depth Information
that the sub-basin lithospheric mantle may not be uniform,
with the thickest lithosphere under the central and southern
portions of the basin. The models can be used to evaluate
whether or not a Proterozoic mobile belt extends to the NW
beneath the northern portion of the Congo Basin, possibly
representing a collisional zone between an Archean block to
the NE and E, referred to by Master (
2004
) as the North-East
Congo Craton (labeled the North-East Congo Shield or
NECS in Fig.
1.11f
) and an Archean block to the W and
SW, referred to by Master (
2004
) as the South-West Congo
Craton (labeled the South-West Congo Shield or SWCS in
Fig.
1.11f
). The SWCS consists of the Ntem and Angola-
Kasai cratons, and the NECS consists of the Bomu Craton,
the West Nile Complex in South Sudan, the northwestern
Uganda Archean Complex, the Tanzania Craton and the
Paleoproterozoic Bangweulu Block. The Mesoproterozoic
mobile belt that Master (
2004
) and Gubanov and Mooney
(
2009
) infer to occur beneath the northern part of the basin is
a continuation of the Mesoproterozoic Kibaran Belt to the
east (recent dating and reinterpretation of the Mesoprotero-
zoic terrains along the eastern boundary of the Congo Basin
defines the northern part of the Kibaran Belt as the Karagwe-
Ankole Belt; e.g.Tack et al.
2010
; Fernandez-Alonso et al.
2012
).
Regardless of the name or age of the mobile belt, the
mobile belt underlying the northern part of the Congo Basin
in the Master (
2004
) interpretation formed as a result of the
collision between the SWCS and the NECS. The Karagwe-
Ankole Belt is in contact in the north with the Archaean
granite-greenstone terrains of the Bomu Craton, but the
contact between them is so poorly mapped that it appears
as a blank on the 1: 2 million geological map of Lepersonne
(
1974
). Structural features visible on satellite imagery and
on radar-based topographic images (e.g. Fernandez-Alonso
et al.
2012
) indicate that the northern end of the Karagwe-
Ankole Belt is marked by an east-west trending sinistral
shear zone that disappears under the Congo Basin
(Lepersonne
1978
). The structural trends of the mobile belt
curve and change from SW-NE to NW-SE as the shear zone
is approached. In the model of Fernandez-Alonso et al.
(
2012
), this contact would have resulted from far-field
stresses associated with distant collisions in the East African
Orogen. Master (
2004
) and Gubanov and Mooney (
2009
)
suggested that the mobile belt continues to the WNW under
the northeastern part of the Congo Basin. De Wit et al.
(
2008
) considered this to be a Neoproterozoic mobile belt
separating two Archean blocks, whereas Master (
2004
) con-
sidered it to be of Mesoproterozoic age, overlain by
Neoproterozoic rocks. Evidence for
10000
060s
090s
100s
9000
8000
7000
6000
5000
4000
3000
2000
1000
0
18
20
22
24
26
28
30
32
Traveltime Misfit (s)
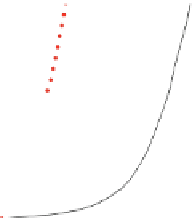
Fig. 1.7
Trade-off curves showing smoothing versus travel time misfit
for 60, 90 and 100 s group velocities
and regions of slower velocities are found beneath the Pro-
terozoic mobile belts to the east and south of the Congo
Shield. In both models, the Ntem Craton has slightly slower
upper mantle velocities compared to the Kasai Craton. Both
models also show a region of slightly faster velocities
beneath the northwestern portion of the Congo Basin to the
east and northeast of the Ntem Craton, and a region of slower
mantle velocities beneath the northeastern portion of the
Congo Basin to the south and southwest of the Bomu Craton.
The major differences between the models is that in our
model the southern and central parts of the Congo Basin
have the fastest upper mantle structure, whereas in the
Fishwick (
2010
) model, the velocities in those regions are
about the same or else slightly slower than beneath the Kasai
Craton and the northwestern part of the basin. These
differences could arise from the different data sets used or
from the different inversion methodologies—the model of
Fishwick (
2010
) shows the fastest velocities beneath the
central part of the basin at slightly greater depths
(125-200 km). Nevertheless, overall similar structure is
obtained using two different sets of surface wave obser-
vations and modeling approaches, with both models showing
velocities diminishing beneath the northeastern part of the
basin. The significance of this velocity pattern for under-
standing the Precambrian lithospheric structure beneath the
basin is discussed in the next section. We also note that the
region of slower mantle velocities beneath the northeastern
side of the Congo Basin is included within the region of
slower mantle velocities in the Pasyanos and Nyblade (
2007
)
model (Fig.
1.2
), but the region of slower mantle velocities
in that model is significantly larger than in our model or the
Fishwick (
2010
) model.
1.6
Discussion
the possible re-
emergence of the mobile belt
to the northwest of the
The seismic tomography models in Figs.
1.2
and
1.11
showing variations in shear wave velocities beneath the
Congo Basin, as described in the previous section, indicate
Congo Basin comes from the
”
(Cahen
1954
; Lepersonne
1974
) rocks (Master
2004
).
These rocks disappear to the NW in the poorly exposed
“
Serie de Liki-Bembe


Search WWH ::

Custom Search