Geology Reference
In-Depth Information
of the basin, but with the fastest velocities found beneath the
southern portion of the basin and Kasai Craton (Fig.
1.2
). In
the Fishwick (
2010
) model (Fig.
1.2
), the Ntem Craton
appears as a relatively fast region compared to the Priestley
et al. (
2008
) model. The isotropic shear wave velocity model
of Sebai et al. (
2006
) shows similar structures to the
Fishwick (
2010
) and Priestley et al. (
2008
) models across
the basin, while the model of Ritsema and van Heijst (
2000
)
shows uniformly fast upper mantle everywhere beneath the
Congo Basin.
The fast velocities observed in the majority of models,
are, however, not seen in the results of Pasyanos and
Nyblade (
2007
). At upper mantle depths of 100-200 km,
their model shows a region of relatively slower velocities
extending from the eastern side of the basin into the interior
of the basin, which is illustrated in Fig.
1.2
. Faster velocities
in this model are found to the south in the vicinity of the
Kasai Craton, to the north beneath the Bomu Craton, and to
the west beneath the Ntem Craton. As mentioned in the
introduction, this is the only model that shows slower
velocities beneath a substantial portion of the Congo Basin,
and it is based on this result that Pasyanos and Nyblade
(
2007
) suggested that beneath the basin there might be
mobile belt lithosphere which is thinner than the lithosphere
beneath the cratons.
Crustal thickness beneath the basin remains poorly
known, with the majority of studies using either the global
model 3SMAC (Nataf and Ricard
1996
) or Crust 2.1 (Bassin
et al.
2000
). Pasyanos and Nyblade (
2007
) used surface
wave tomography to estimate crustal thickness across the
whole continent. For a comparison of these three crustal
models, we refer the reader to Fig. 3 in Fishwick and Bastow
(
2011
).
As discussed by Buiter et al. (
2012
), lithospheric thick-
ness beneath the basin has been estimated in a number of
studies. Pasyanos (
2010
) estimated ~130-160 km thick litho-
sphere compared to 160-180 km beneath parts of the Bomu
Craton, 160-200 km beneath the Kasai Craton, and over
200 km thick beneath the Ntem Craton. Fishwick (
2010
)
reported lithospheric thicknesses of
Latitude (deg)
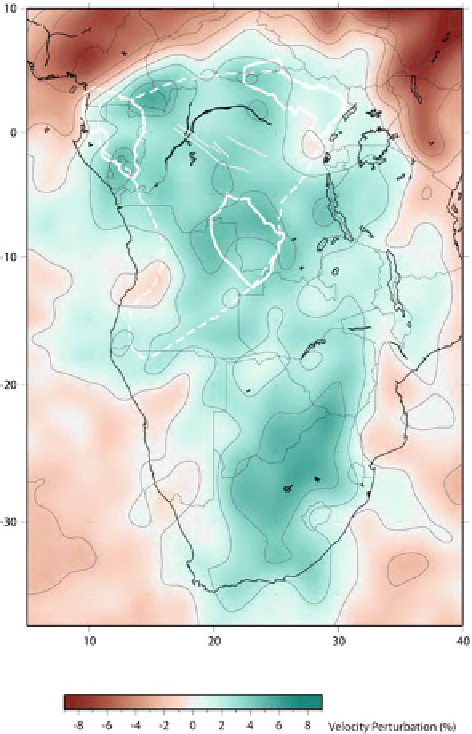
Fig. 1.2
High resolution shear velocity model at 100 km depth from
Fishwick (
2010
). Velocities are plotted as perturbations from the refer-
ence model ak135,
green/blue shades
showing faster velocities and
red/
brown
slower velocities. The outline of major Archean cratons (see
Fig.
1.1
for more details) are shown with
solid white lines
, the greater
Congo Shield with the
dashed white line
, the inferred location of
Neoproterozoic rifts with
grey lines
, and the area of slow velocities at
100 km depth in the Pasyanos and Nyblade (
2007
) model with a
dashed
black line
It is very difficult to accurately assess the uncertainty on
these thickness estimates. The tomographic models them-
selves have vertical resolution of ~25-50 km for depths
shallower than ~200 km, although this is dependent on the
exact periods and techniques used. Different approaches for
converting velocity to thickness further challenge compari-
sons between the various models. It is, therefore, difficult to
have confidence in variations of less than ~50 km in litho-
spheric thickness.
200 km beneath the
southwestern and central parts of the basin, with lithosphere
thinning to around 160-200 km adjacent to the margins of
the basin and beneath the Bomu, Ntem and Kasai cratons.
Priestley et al. (
2008
) reported considerably different litho-
spheric thicknesses from Fishwick (
2010
) in spite of using
very similar modeling methodologies. In a more recent
update, Priestley and McKenzie (
2013
) estimate the thickest
lithosphere (
>
210 km) beneath the central part of the basin
and thinner lithosphere (170-200 km) beneath the Ntem and
Kasai Cratons. In their model, lithospheric thickness drops
sharply on the northeastern margin of the basin and to the
southwest of the basin.
>
1.4
Shear Wave Tomography
To advance our understanding of upper mantle structure
beneath and surrounding the Congo Basin, we have devel-
oped a new shear wave velocity model using all available


Search WWH ::

Custom Search