Geology Reference
In-Depth Information
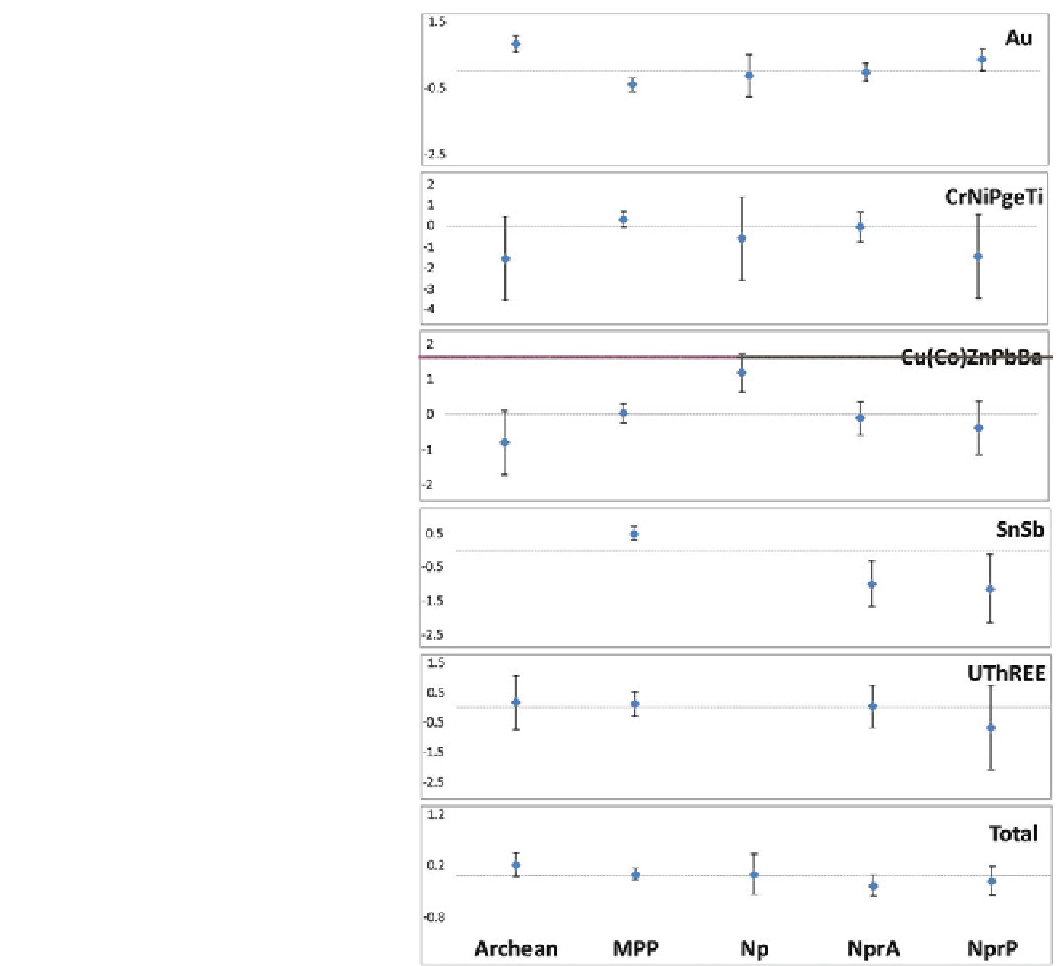
Fig. 19.5
Mineral diversity in
Central Africa Shield, as shown
by plotting the (natural log, Y-
axis) spatial coeffient (ln
r
ij
)of
the five element groups (and the
total of these groups [lower most
plot]). Confidence
intervals
Standard Error.
Note how each geologic domain
has a unique combination of
elements that we term their
'
Metallogenic fingerprint
'
. Note
that if the Confidence Interval
include 0, the fingerprint is
classed as random
¼
2
To summarize, Fig.
19.9
clearly shows the following:
• Gold: CA and CAS display similar fingerprints, e.g. for
Archean areas there is a significant fingerprint in both
regions. For MPP there is a negative association. The data
for CS not reliable.
• CrNiPgeTi: CS and CAS have similar fingerprints, while
CA displays a different fingerprint. However only for the
Archean in the CA do we observe a significant signal.
• CuZnPbBa: CA and CAS display similar fingerprints,
except here the only significant signals occur in the
Neoproterozoic areas of CAS.
• SnSb: CS shows a significant signal similar to that of the
CA; in the CAS there is a lack of data in the Archean
domains.
• UTHREE: CS signals are significant in MPP, whilst CA
shows significant signals in Neoproterozoic.
Search WWH ::

Custom Search