Geology Reference
In-Depth Information
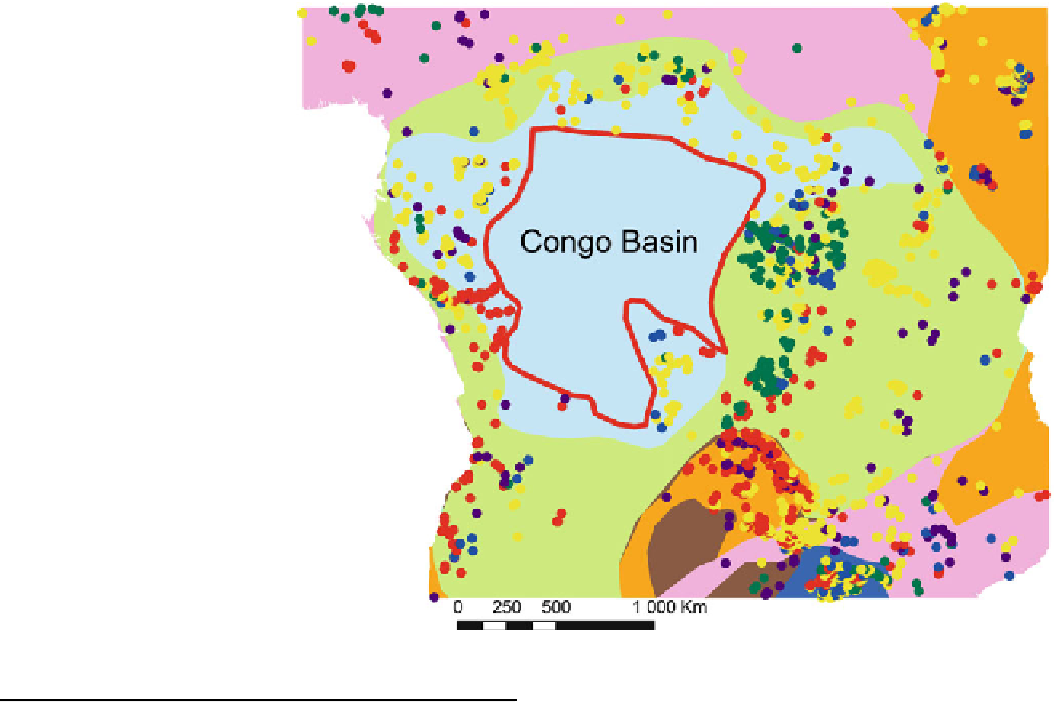
Fig. 19.3
General area of
Central Africa (ca. 6.9 million
km
2
) with its known mineral
deposits, showing outlines of the
Central African Shield (CAS;
pale green
; ca. 3.6 million km
2
);
Congo Shield (CS;
pale blue
; ca.
2.7 million km
2
) and the
approximate outline of the
preserved Congo Basin cover
(CB;
red line
, ca. 1.3 km
2
) for
which mineral potential and
metalliferous fingerprints are
calculated
area of the Congo Shield region and its mineral deposits
from further analyses of CA and CAS.
19.5 Discussion
19.5.1 Fingerprints of the Central Africa,
Central African Shield and Congo Shield
19.5.1.2 Central Africa
In Archean areas of Central Africa (Table
19.2a
,Fig.
19.4
)we
observe a strong positive association in three mineral groups
(Au (1.22), CrNiPgeTi (1.27), SnSb (0.84); Table
19.2a
,line
marked Archean). But there is only random distribution for the
two mineral groups UThRee and CuZPbBa.
For MPP areas, we observe a positive fingerprint for SnSb
(0.77); all other fingerprints are random, except for Au
which displays a negative association.
In the Neoproterozoic areas we observe a positive finger-
print for all minerals except SnSb contain (no data). The
fingerprint for Au indicates a small (positive) association
between Au and Neoproterozoic rocks (e.g. the error bar is
just above zero).
In the NprA area we observe only random patterns for all
mineral groups, whilst in the NprP areas we observe only a
negative associations (e.g. no mineral deposits of any kind
are predicted to occur here).
First we explore the metallogenic fingerprints of the CA,
CAS and the CS. Positive values of the fingerprint (ln r
ij
)is
an indication that there is a positive association between the
geology and the mineral deposit distribution within each
domain. Negative fingerprints are an indication of negative
association between the geology and the mineral deposits
within each domain. We also use Standard Errors (in
brackets in Table
19.2
, and displayed as 2
Standard Devi-
ation in the Figs.
19.4
,
19.5
,
19.6
) to evaluate if a fingerprint
has significance: if the error bars include 0, the fingerprint is
viewed as displaying random associations.
19.5.1.1 Congo shield
The Congo Shield contains only 226 deposits across a vast
area of 2.7 million km
2
, resulting in metallogenic
fingerprints that are random (Fig.
19.6
, Table
19.2c
), except
for the SnSb fingerprint (2.15) and the UTHREE fingerprint
(1.58) in the geologic domain MPP. Note that the NprP
domains have no data at all; and the large Standard
Deviations in Table
19.1c
confirms that we are dealing
here with large uncertainties. We therefore exclude the
19.5.1.3 Central Africa Shield
In general the fingerprints in the CAS (Table
19.2b
,
Fig.
19.5
) are lower than that of the CA. The most significant
contributor to this difference between the metal potential of
CA and CAS is the large number of deposits related to the

Search WWH ::

Custom Search