Geology Reference
In-Depth Information
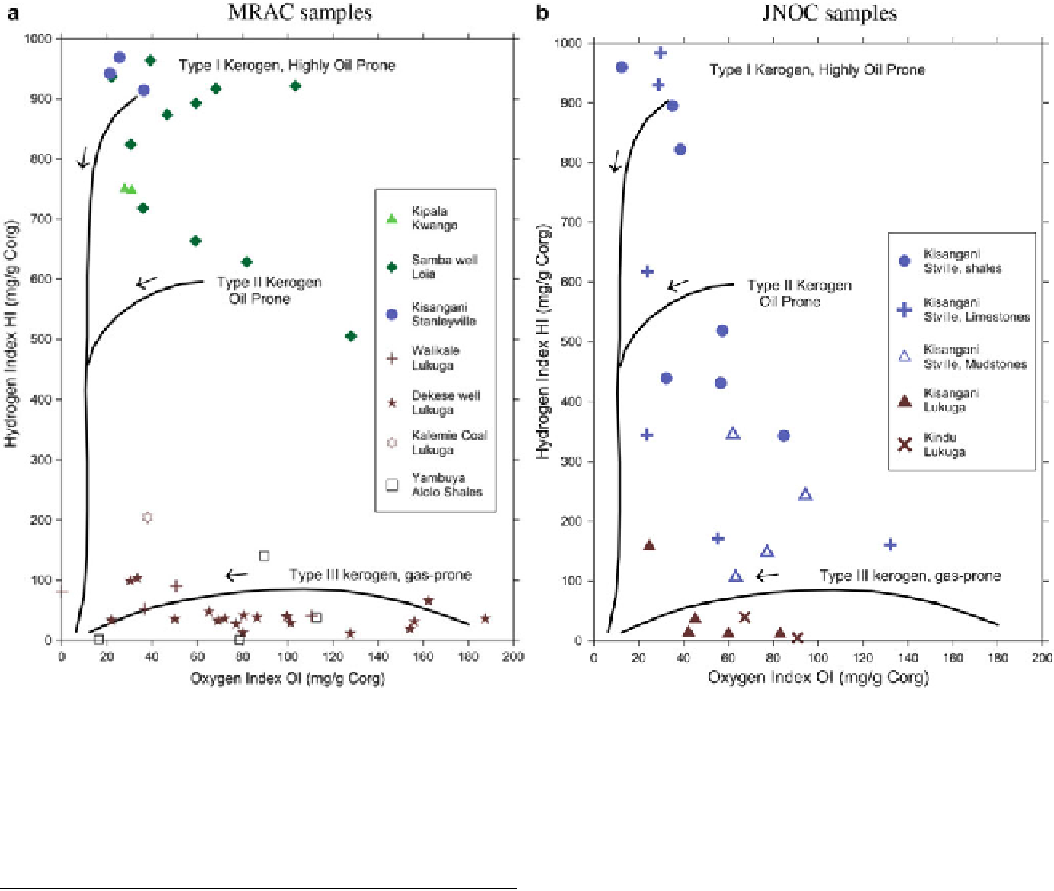
Fig. 18.4
Rock-Eval characterization of kerogen maturation
characterized on a Espitalie diagram (Espitalie et al.
1977
), by the
Hydrogen Index HI and Tmax (temperature of maximum release of
hydrocarbons).
Bold lines
show the evolution path of kerogen types
with thermal maturation (along the direction shown by the
arrows
).
Dotted lines
show maturation isogrades corresponding to vitrinite (or
equivalent) values and separate the maturation zones. (
a
) RMCA
samples, analyzed by RWTH Aachen (Sachse et al.
2012
), with two
samples of Kipala shales from Kadima (
2007
). (
b
) JNOC samples
(JNOC
1984
). Data from Tables
18.1
and
18.2
Zone from the Gas Zone. All the samples of the RMCA from
the Stanleyville and Loia Groups and from the Kipala Shale
fall in the Immature Zone. Some have Tmax values between
430 and 440
, but because they have high HI, they are still
immature. Only a few samples of the Stanleyville Group
collected by JNOC display HI lower than 450 and are close
to the onset of the Oil Zone. The Stanleyville, Loia and
Kipala source rocks are all immature, as indicated by their
Tmax and Vr values.
Samples from the Lukuga Group present a range of Tmax
values, between 410 and 455
C(Fig.
18.3
). The few outcrop
samples analysed are in the same range, with a higher maturity
for the varval shales of Walikale. Based on vitrinite reflec-
tance (Table
18.2
,Fig.
18.5
), the gas-prone Lukuga source
rocks are generally in the oil window in the Dekese well,
except below 1,300 m deep, where they enter the gas window.
However, the Tmax values indicate a lower maturity, mostly
in the Immature Zone. On the Vr-Tmax diagram (Fig.
18.5
),
these values display an almost negative correlation, far from
18.5
Thermal Maturation
The thermal evolution of the source rocks is evaluated by the
Rock-Eval Tmax (
C) parameter and vitrinite reflectance data
(Vr%). Using the Total Organic Carbon (C
org
) content and
Rock-Eval pyrolysis data, kerogen maturity level is expressed
in the Van-Krevelen HI-OI (Fig.
18.3
)andEspitalieHI-Tmax
(Fig.
18.4
) diagrams by composition trends in function of
thermal maturation for different types of organic matter.
The Rock-Eval Tmax values correspond to temperature of
maximal release of hydrocarbons during pyrolysis (summit of
the S2 peak; Espitalie et al.
1977
). On an Espitalie diagram,
the Hydrogen Index (mg HC equivalent/g C
org
)decreases
progressively with maturation, while the Tmax (
C) increases
(Fig.
18.4
). In the Van-Krevelen diagram (Fig.
18.3
), the
vitrinite reflectance isolines separate the thermal maturation
zones, with Vr
0.5 % separating the Immature Zone from
the Oil generation Zone and Vr
¼
¼
1.3 % separating the Oil

Search WWH ::

Custom Search