Geology Reference
In-Depth Information
Fig. 16.11
Locations of Airborne electromagnetic survey block along the Kwango River
Where possible, the helicopter maintained a mean terrain
clearance of 85 m, which translated into an average height of
33 m above ground for the bird-mounted VTEM system.
Nominal survey speed was 80 km/h. The data recording rates
of the data acquisition was 0.1 s for the electromagnetics,
and 0.2 s for altimeter and GPS. This translates to a geo-
physical reading about every 2 m along flight track.
The conductivity of a rock or sediment depends on the
conductivity of the contained water or fluid, and the amount
and manner in which the water is distributed within the rock/
sediment. The resistivity varies with porosity, cementation,
degree of saturation and water salinity. In general argilla-
ceous sediments, such as clays, can retain water in its struc-
ture and are therefore more conductive than sandy or
arenaceous sediments.
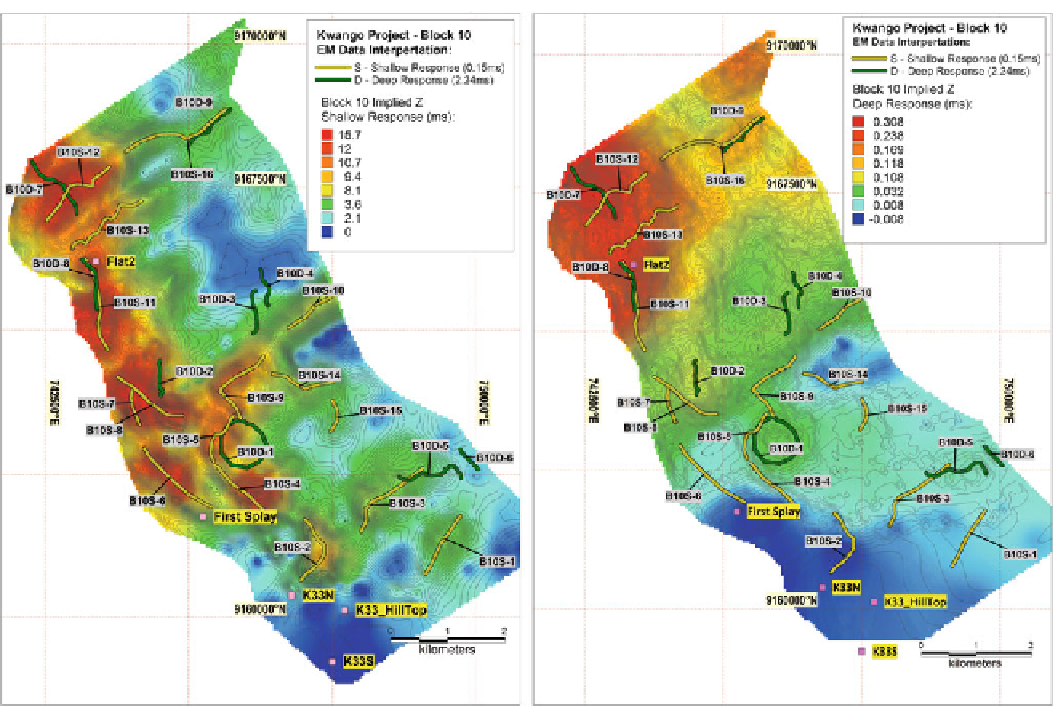
Block 10 is an example of one of the VTEM surveys
(Fig.
16.12
) illustrating the shallow and deep responses.
Some anomalies have been interpreted to be possible
channels cut into level basement that is footwall to the
alluvium and therefore present areas of potentially thicker
gravels. Others are clearly related to active tributaries run-
ning across the flats and terraces.
Similar interpretations have been done for all of the eight
blocks and these have yielded numerous electromagnetic
anomalies, including a significant number of topographically
elevated sediment packages which are interpreted as being
part of the Quaternary cover.
The results of the test surveys have shown that the elec-
tromagnetic method is suitable for mapping the shallow
geology (less than 50 m) and since there is a high electrical
contrast between the palaeo-channel and host rock (Blume
and K
¨
stlin
2006
) it has shown to be a very effective tool in
mapping some of the channels in both the terraces and river
flats. Figure
16.12
shows that the shallow responses (yellow
lines) and related 150 microsecond time channel (left) versus
the deep responses (green lines) picked up with the
2,240 microsecond time channel (right) can be overlapping.
The shallow responses are generally associated with channel
filled clays-rich sediment whilst the deeper anomalies are
more likely to be associated with bedrock structures.
Search WWH ::

Custom Search