Geology Reference
In-Depth Information
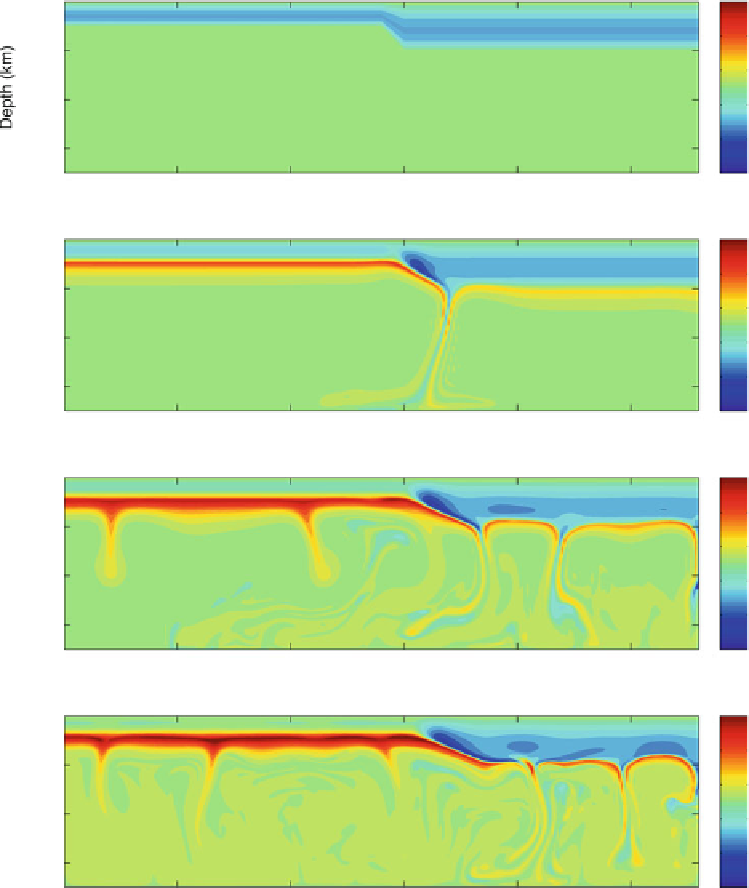
a
b
c
d
Fig. 12.7
Density of the model domain as convective instabilities
form and the lateral change in density drives horizontal flow of the
transition region. (
a
) Density at 0 Myr, which is the model initial
condition with a 100 km wide transition zone between lithosphere
thickness of 100 km on the
left
and 200 km on the
right.
(
b
) 50 Myr:
where a single drip-like instability has formed due to the corner flow set
up by the transition in lithosphere thickness. (
c
) 100 Myr: where
convective instabilities have formed beneath both the thick and thin
lithosphere with a characteristic spacing of roughly 400-600 km. (
d
)
150 Myr: where the interaction between the lateral change in density
and convective instabilities has caused a change in the pattern of
instabilities, the cause of change in surface topography
elevation at two locations, within the thinner lithosphere
(1,250 km, Fig.
12.7
) and within the thicker region of litho-
sphere (1,750 km), we find that locally the episodic change
in elevation has a magnitude of roughly 200 m, with changes
occurring over periods of 20 to 40 Ma (Fig.
12.9
). This
prediction is assuming that the upper mantle deforms by a
very simple diffusion creep. It is more probable that the
upper mantle deforms principally by dislocation creep that
is pressure and temperature dependent (Asaadi et al.
2011
;
L
´
vy and Jaupart
2011
). This would increase the rate of
change of topography, as instabilities would form at supra-
exponential rates rather than simply exponential (Conrad
and Molnar
1997
; Armitage et al.
2013
). Edge-driven con-
vection is clearly not a basin forming mechanism, but the
changes in topography due to the natural movement of a
evolving continental lithosphere will cause regional changes


Search WWH ::

Custom Search