Geology Reference
In-Depth Information
Tshikapa Area (154/155)
Kananga Area & Mbuji-Mayi Areas (157 & 172)
Kabinida Area (173/159)
inferred faults
inferred fault
inferred faults
GREEN LINE = PRESENT TOPOGRAPHY
meters above
sealevel
750 m
0 m
0 m
O
O
700 m
O
C
O ?
5 m
0 m
O
650 m
T1
~79-120 Ma
detrital
zircons
600 m
C4
550 m
C3
540 m
530 m
520 m
510 m
500 m
50m
45 m
40 m
35 m
30 m
25 m
20 m
15 m
10 m
C2
500 m
0 m
5 m
C1
490 m
T1: Paleogene
(Kalahari Gp equivalent)
450 m
C3/C4: Upper Cretaceous
(Kwango Gp equivalent)
C1/C2: Lower Cretaceous
(Loia Fm equivalent)
BASEMENT
400 m
J1: Jurassic-Cretaceous
(Stanleyville Fm equivalent)
350 m
CROSS-SECTIONAL PROFILE OF FIELD AREA; LOCATION OF LINES A AND B SHOWN ON MAP
B'
B
A'
A
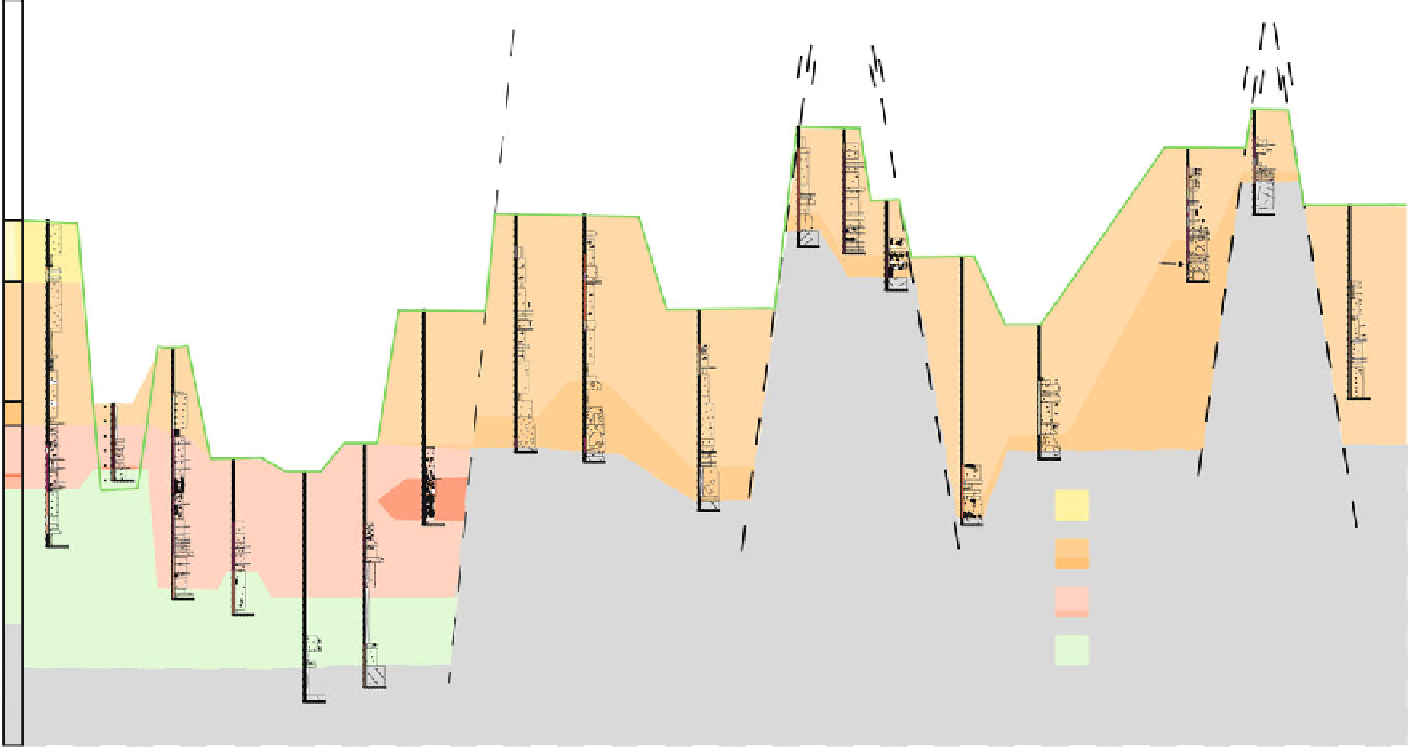
Fig. 9.9
Fence diagram for seventeen core logs and one outcrop section from across the Kasai
study area. Depth to basement is based on basement intercept depths and the regional surface
topography is used as the baseline for hanging all sections and core logs. The Kasai study area
shows a complex stratigraphic framework with irregular basement topography and seven
distinct stratigraphic units (note only six shown on fence diagram) that can be correlated across
the study area


Search WWH ::

Custom Search