Geology Reference
In-Depth Information
6.3.3.5 Sequence 4
Overlying the lower regional unconformity, a parallel to
subparallel seismic pattern marked by moderate to low con-
tinuous reflectors constitutes the fifth sequence (e.g.
Sequence 4 of Daly et al.
1992
). Its upper boundary is
another angular unconformity that constitutes the second
(or upper) regional unconformity in the CB. Well logs
show that Sequence 4 is mostly siliciclastic, comprising
red sandstones and conglomerates. According to the inter-
pretation of seismic profile R5 (Fig.
6.2a
), this sequence is
1,390 m thick in the region of the Mbandaka-1 well, between
depths ca. 877 m and ca. 2,270 m. It corresponds to the M5
and M6 sequences of Linol (
2013
, and assigned to the
Triassic). On CDP 850 along line 51, it is ca. 1,870 m
thick, between ca. 1,120 m and ca. 2,990 m deep.
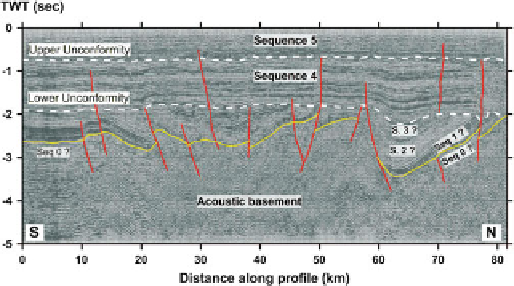
Fig. 6.4
Seismic stratigraphy and structural interpretation of N-S
seismic line L50 in the center (Fig.
6.1b
). The lower unconformity
has been deformed during or after deposition of Sequence 5 by reacti-
vation of underlying structures.
Yellow line
: folded and faulted reflector
at the base of strongly reflecting sequence 2.
TWT
Two Way Traveltime
(Seconds)
6.3.3.6 Sequence 5
The sixth and youngest seismic sequence (Sequence 5)
consists of parallel highly continuous reflectors grading
upwards to wavy moderate to strong reflectors. The lower
boundary of this sequence corresponds to the upper regional
unconformity as defined above. Well logs and outcrop data
show that it contains essentially continental clastic formations
ranging in age from the Late Jurassic to the Neogene. It
appears undeformed on the seismic profiles and has a rela-
tively constant thickness over the entire CB: 715 m at Dekese
(Cahen et al.
1960
), 1,167 m at Samba (Cahen et al.
1959
),
844 m at Mbandaka and 998 m at Gilson (Esso Zaire
1981a
;
Linol
2013
), and ~1,120 m thick along line L51 at CDP 850.
To directly compare their seismic-stratigraphic
interpretations of the CB, Kadima et al. (
2011a
) regroup
the first four sequences of Daly et al. (
1992
) into a lower
seismic unit (Unit A), contained beneath the lower major
unconformity. This Unit A is locally affected by tectonic
deformation. By correlation with the depocenters
surrounding the CB and considering that this lower uncon-
formity could represent the end of Pan-African deformation,
the seismic Unit A likely represents the equivalent the
Neoproterozoic sedimentary sequences flanking the CB.
Sequence 4, which is bound between the two regional
unconformities, is named seismic Unit B, and possibly
represents the Paleozoic and early Mesozoic (e.g. Triassic;
see below). In this scheme, the uppermost seismic Unit C
would represent the Jurassic-Cretaceous and Cenozoic.
between 2,644 m and 3,960 m depth (1,316 m thick). It also
broadly corresponds to conglomeratic and sandstone
sequences M9 and M8 of Linol (
2013
). The transparent
character is well seen in the seismic profile R51 (Fig.
6.3
),
where at CDP 850, it is ca. 1,660 m thick and its base is at ca.
7,070 m deep (Table
6.2b
).
6.3.3.4 Sequence 3
Sequence 3 has a banded seismic pattern characterized
by slightly divergent and strongly to moderately continuous
reflectors. An angular unconformity observed along the
deformed part of the basin constitutes the upper boundary
of the sequence, which defines the lower major regional
unconformity and can be detected on most of the seismic
profiles (Daly et al.
1992
; Kadima
2011
; Kadima et al.
2011a
,
b
). The angular character of this unconformity is
well defined in the southern part of profile L51 (Fig.
6.3
),
and in the central part of profile L50 (Fig.
6.4
). In profile R5
(Fig.
6.2a
), it appears as a conformable contact and is there-
fore more difficult to identify. In the R5 profile, at the
location of the Mbandaka-1 well, Sequence 3 appears
between ~2,270 and ~2,640 m deep (Table
6.2
) and is
correlated in the Mbandaka-1 well with the red-orange
conglomerates of the M7 sequence of Linol (
2013
). This
sequence is observed in line L51 at the position of CDP 850,
between ~5,410 and ~2,990 m (~2,420 m thick; Table
6.2b
).
We tentatively correlate this Sequence 3, together with
the underlying Sequence 2, with similar (predominantly
clastic) sequences in the marginal basins: the molassic
Mpioka Group in West Congo (Frimmel et al.
2006
), the
predominatly clastic Kundelungu and Nguba Groups in
the Katanga basin (Cailteux et al.
2007
), and the
dominantly clastic Aruwimi Group in the Lindian basin
(Verbeek
1970
).
6.3.4 Tectonism
The Neoproterozic sequences of the seismic Unit A as
defined above have been affected by Pan-African defor-
mation. Some of those structures apparently have been
reactivated also by late Paleozoic-early Mesozoic
deformations. In contrast, the lower-middle Paleozoic red

Search WWH ::

Custom Search