Environmental Engineering Reference
In-Depth Information
1.2
0.010
A
0.009
1.0
0.008
0.007
0 20406080
0.8
Time (hr)
0.6
O
irr
= 296
0.4
1.2
0.010
B
0.009
1.0
0.008
0.007
0 20406080
0.8
Time (hr)
0.6
O
irr
= 313
0.4
0
20
40
60
80
100
Time (hr)
1.4
0.010
C
1.2
0.008
0.005
1.0
0.003
0.8
0
50 100 150
Time (hr)
0.6
0.4
0.2
O
irr
= 366
0.0
0
50
100
150
200
Time (hr)
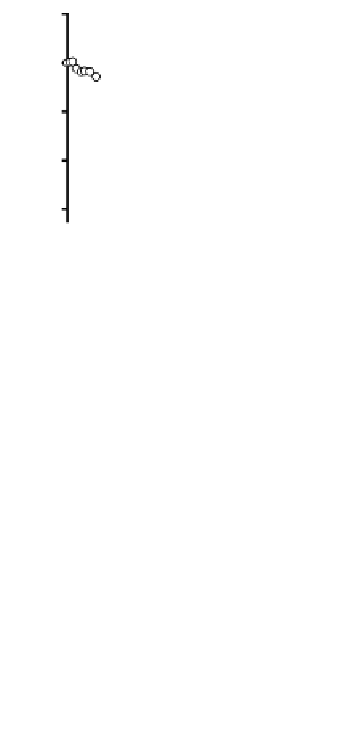
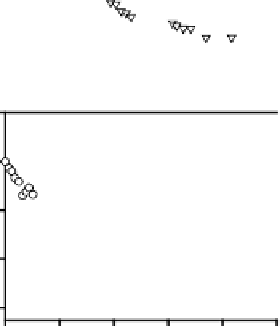
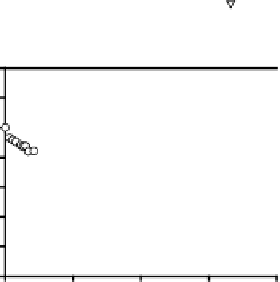
Figure 8.
Fractional loss of a(355) (2) and F/R () with time (hours) during monochromatic
irradiation of SRFA at 296 nm (Figure A), 313 nm (Figure B) and 366 nm (Figure C). Insets:
Dependence of ) (O) on irradiation time. [F/R is the fluorescence intensity (F) (O
ex
355 nm)
normalized to the Raman intensity (R) (O
ex
355) as reported in Hoge et al.
73
. )(355) is the
fluorescence quantum yield as defined in Green and Blough
15
.
Further, under monochromatic light exposure, the CDOM absorption (at 355 nm)
and fluorescence (O
ex
355 nm) decay as a single exponential away from the irradiation
wavelength (Figure 8A) indicating that all the chromophores are decaying with the
same rate constant. On the other hand, closer to the irradiation wavelength the CDOM
absorption and fluorescence decay as a sum of two exponentials (Figures 8B, 8C),
suggesting the presence of at least two pools of chromophores decaying with different
rate constants. These and other observations suggested that the CDOM absorption
spectrum cannot be solely due to a superposition of independent chromophores
49
.


Search WWH ::

Custom Search