Database Reference
In-Depth Information
a
b
32
90
NN−CBIR after initial LTRF using T
B1
NN−CBIR after the second LTRF using T
B2
NN−CLBIR after initial LTRF using T
B1
NN−CLBIR after the second LTRF using T
B2
30
80
28
70
26
60
24
50
22
40
20
30
18
NN−CLBIR after initial LTRF using T
B1
NN−CLBIR after the second LTRF using T
B2
NN−CBIR after initial LTRF using T
B1
NN−CBIR after the second LTRF using T
B2
20
16
10
14
12
0
0
1
2
3
4
5
6
7
8
9
0
20
40
60
80
100
Number of Relevance feedback iterations
Recall (%)
c
d
80
100
SVMAL−CBIR after initial LTRF using T
B1
SVMAL−CBIR after the second LTRF using T
B2
SVMAL−CLBIR after initial LTRF using T
B1
SVMAL−CLBIR after the second LTRF using T
B2
90
70
80
70
60
60
50
50
40
40
30
SVMAL−CBIR after initial LTRF using T
B1
SVMAL−CBIR after the second LTRF using T
B2
SVMAL−CLBIR after initial LTRF using T
B1
SVMAL−CLBIR after the second LTRF using T
B2
20
30
10
20
0
1
2
3
4
5
0
20
40
60
80
100
Number of Relevance feedback iterations
Recall (%)
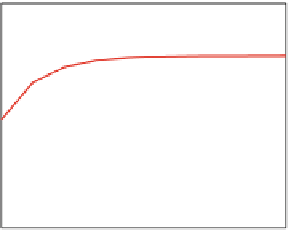
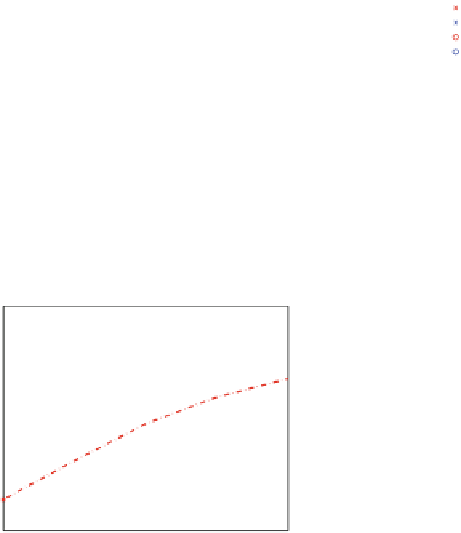
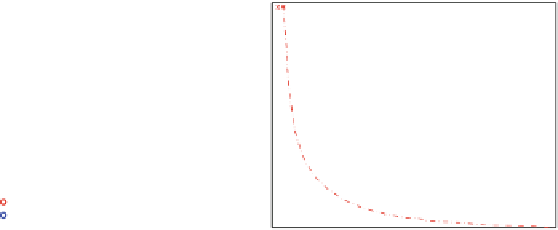
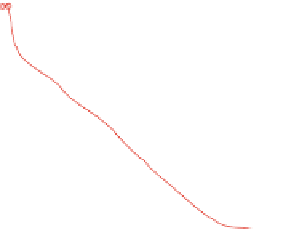
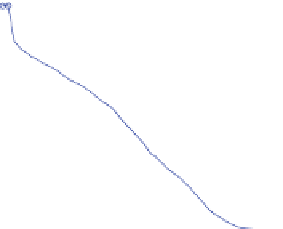
Fig. 2.8
(
a
) Comparison between the performance of NN-CBIR and NN-CLBIR in terms of the
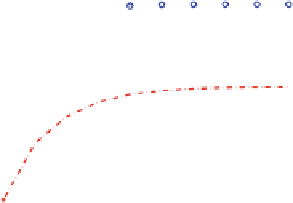
average precision versus the number of relevance feedback iterations; (
b
) comparison between
the performance of NN-CBIR and NN-CLBIR in terms of the precision versus recall after the
first retrieval iteration; (
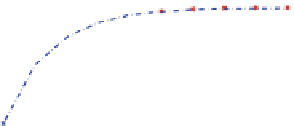
c
) comparison between the performance of SVMAL-CBIR and SVMAL-
CLBIR in terms of the average precision versus the number of relevance feedback iterations;
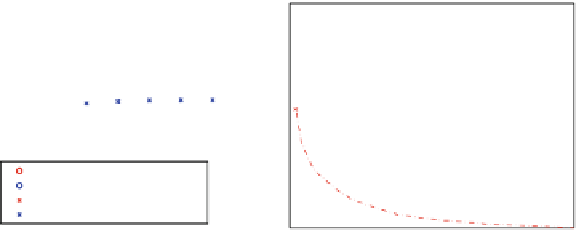
(
d
) comparison between the performance of SVMAL-CBIR and SVMAL-CBIR in terms of the
precision versus recall after the first retrieval iteration
knowledge through the LTRF. Based on the same query set, the performance of
NN-CBIR remains unchanged. To test the performance in terms of ranking ability,
the precision-versus-recall curve (PRC) is employed. The recall is defined as
R
=
N
C
/
N
G
, where
N
G
is the number of images in the same classes as that of the query.
The precision is averaged over all queries at each different recall value. The PRC
after the initial retrieval is shown in Fig.
2.8
b. Higher precision values at a certain
recall indicates more relevant images being ranked ahead of irrelevant ones, i.e. to
reach the recall value, a smaller set of retrieved images has to be processed. Based
on this fact, the advantage of the integration of user history as high-level knowledge
with the content analysis can be demonstrated based on the comparison in Fig.
2.8
b.


Search WWH ::

Custom Search