Database Reference
In-Depth Information
1
0.9
0.8
0.7
0.6
0.5
0.4
0.3
0.2
ECA
ECA without Edge Mask
0.1
0
0
2
4
6
8
10
12
14
16
18
20
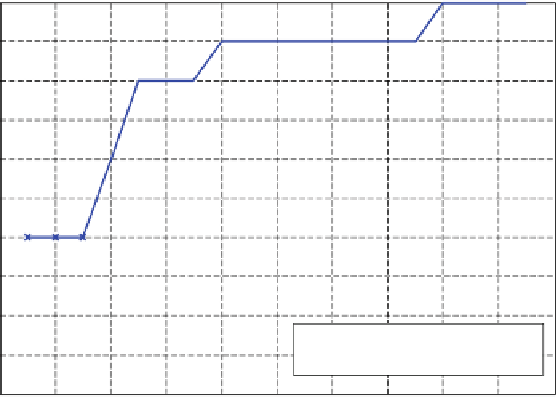
Number of Top Matches, (n)
Fig. 6.10
, as a function of the number of top matches, averaged over
all ten queries, comparing the ECA method with and without the application of an edge mask
Average Recall rate,
R
(
n
)
It was observed from the experimental results that the performance of the ECA
image-matching method is dependent on two factors: (1) the two parameters of
ʾ
COV
ʾ
EDG
, which describe the degree of similarity of sub-images and the
edge density, respectively, and (2) the edge mask. Parameters
and
ʾ
COV
and
ʾ
EDG
are
ʾ
COV
=
.
ʾ
EDG
=
experimentally chosen, and the values of
7% provide
the best results. These were used throughout for all the experiments reported in
Table
6.3
and Fig.
6.8
. For the second factor, Figure
6.10
shows the comparison of
an averaged recall rate between the ECA methods with and without the application
of the edge mask. It can be seen from the figure that the averaged recall rate drops
by 7.9 % when the ECA method is used with no application of the edge mask.
0
7 and
6.5
Summary
An image matching process which emphasizes on saliency information could have
significant potential for digital forensic applications. The chapter demonstrates that
saliency information in the form of the effective correlation areas on the image-
data pair can improve accuracy for cartridge case image matching. In view of
the fact that segmenting an effective correlation area will inevitably throw away
some information in the image, it is imperative to determine the best matching
positions. This work shows that these positions can be determined by cross-
covariance coefficients and edge density. It is also shown that as far as localization


Search WWH ::

Custom Search