Image Processing Reference
In-Depth Information
were manually segmented by two users.
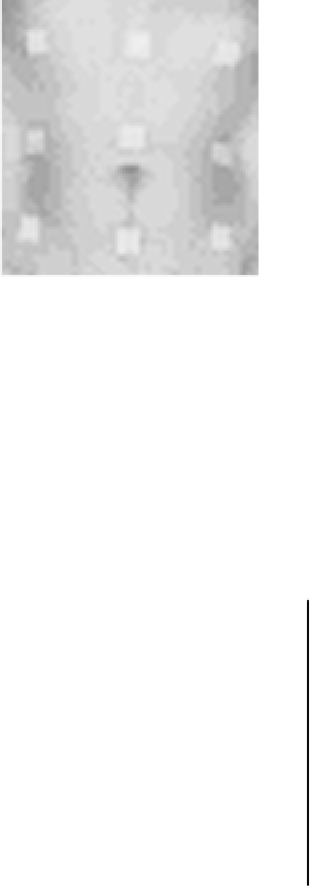
FIGURE 1
Example of input data: intensity map for ToF camera of abdomen with nine square
markers.
3 Results
For the different methods of finding correspondences, evaluation scores: surface distances,
correspondence distances and average marker error, are presented in
Tables 1
and
2
.
Table 1
Surface distances for four variants of ICP
Surface Distance [mm]
ID
Initial E
NH SM DM
1
5.83
0,21
0.6
0.69 0.63
2
12.04
0.12
0.74 0.87 0.61
3
25.16
0.03
0.03 0.06 3.43
4
19.84
0.14
1.04 0.51 3.56
5
5.21
0.004 0.21 0.28 0.28
6
10.76
0.16
0.15 0.09 1.94
E, the Euclidean distance; NH, normal vectors with initial rigid registration; SM, static; DM, dynamic markers vectors.


Search WWH ::

Custom Search