Image Processing Reference
In-Depth Information
Experimental results and discussion are provided in
Section 5
. The last section concludes the
chapter with future work.
2 Image Categories
The simplest classification of the crystallization trials distinguishes between the non-crystals
(trial images not containing crystals) and crystals (images having crystals). In this study, we
are interested in developing a system to classify different crystal types. We consider four im-
age categories (needle crystals, small crystals, large crystals, and other crystals) for protein
crystallization images consisting of crystals. Here description of each category is provided:
Needle crystals
: Needle crystals have pointed edges and appear as needles. These crystals can
appear alone or as a cluster in the images. The overlapping of multiple needle crystals on top
of each other makes it difficult to get the correct crystal structure for these images.
Figure 1
(a-c) show some sample crystal images under this category.
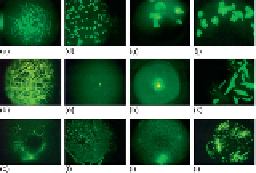
FIGURE 1
Sample protein crystallization images: (a-c) needles, (d-f) small crystals, (g-i)
large crystals, and (j-l) other crystals.
Small crystals
: This category contains small-sized crystals. These crystals can have two- or
three-dimensional shapes. These crystals can also appear alone or as a cluster in the images.
Because of their small size, it is difficult to visualize the geometric shapes expected in crys-
tals. Besides, the crystals may be blurred because of focusing problems.
Figure 1
(d-f) provide
some sample images under this category.
Large crystals
: This category includes images with large crystals with quadrangle (two- or
three-) shapes. Depending on the orientation of protein crystals in the solution, more than one
surface may be visible in some images.
Figure 1
(g-i) show some sample images under this
category.
Other crystals
: The images in this category may be a combination of needles, plates, and oth-
er types of crystals. We can observe high intensity regions without proper geometric shapes
expected in a crystal. This can be due to focusing problems. Some representative images are
shown in
Figure 1
(j-l).
3 System overview
The images of crystallization trials are collected using Crystal X2 software from iXpressGenes,
Inc. The protein solutions are labeled with trace levels (<1%) of fluorescent dye. Green light
the system diagram of the crystallization trials to classify systems. We first down-sample the
images by eightfold from 2560 × 1920 to 320 × 240 and crop 10 pixels at the borders from each
side. This reduction enables feature extraction faster without losing necessary details for fea-
ture extraction. The downsampled image is input to the image binarization technique. Image
segmentation is performed on the binary images, and region features are extracted. Likewise,
Search WWH ::

Custom Search