Image Processing Reference
In-Depth Information
varies as well as the number of testing and training. We used two different sizes ([20 × 60] and
each time and, respectively, the remaining 8, 7, and 6 images to test. All implementations in
each part were repeated as many times as the number of total eigenvectors.
6.1 Experimental Setup-1
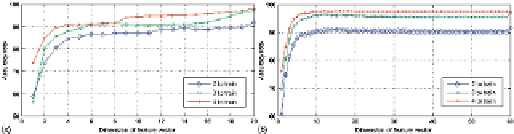
In this section, we explain the analysis with respect to the images with size of (20 × 60) for the
sake of understanding. To analyze the system in column direction and get the output, we irst
restate that the images are in dimension of (20 × 60) meaning that if we map them in column
direction, there will be 60 samples with the dimension of 20 to map. The output of such a map-
ping function will be a matrix with the dimension of (60 × 60). By applying 2DPCA on this
matrix, there will be 60 eigenvectors extracted with the dimension of 20. In this step, there
are 60 different dimensions which could be reduced using projection in 2DPCA meaning that
there are 60 different projections using different number of eigenvectors. We conducted the al-
gorithm 60 times in each of three different types (2, 3, and 4 samples to train and 8, 7, and 6
samples to test, respectively) of our implementation and calculated the accuracy rate in each
adding the number of samples for train, the accuracy goes up no matter which method to use.
Another expectation was that by using more eigenvectors, the accuracy rate goes higher up to
its optimized point, which here is almost near the dimension of 20. It is observed from
Figure
4
that using 2, 3, and 4 images to train leads to the accuracy rate of around 90%, 95%, and 97%,
respectively. Another prime issue is that the time consumed for this experiment is much more
than the next as there are 60 and 20 eigenvectors in column direction mapping. It is also ob-
served that by making the image size smaller the accuracy rate drops. It is because by making
the size of images smaller, some information are lost.
FIGURE 4
Accuracy rates obtained using K2DPCA in column direction on finger vein data-
base: (a) (10 × 20) sample size and (b) (20 × 60) sample size.
6.2 Experimental Setup-2
To analyze the system in row direction, the input images were used in a way that each image
consists of 20 samples with the dimension of 60 to map. The output of such a mapping func-
tion will be a (20 × 20) matrix. By applying 2DPCA on this matrix, there will be 20 eigenvectors
extracted with the dimension of 20. In this step, there are 20 different dimensions which could
be reduced using projection in 2DPCA meaning that there are 20 projection manners using
different number of eigenvectors.
Figure 5
demonstrates the accuracy rate of the experiments
along the row direction. Implementing this method using 2, 3, and 4 images to train results to
the accuracy rate of around 95%, 97%, and 99%, respectively, which is clearly higher than the
column direction. Mapping the input data along the row not only achieves higher accuracy
but also has less consumption of time as there are only 20 dimensions of data to be reduced.
Same as the previous experimental setup, the overall accuracy rate in (10 × 20) is not as high as
Search WWH ::

Custom Search