Image Processing Reference
In-Depth Information
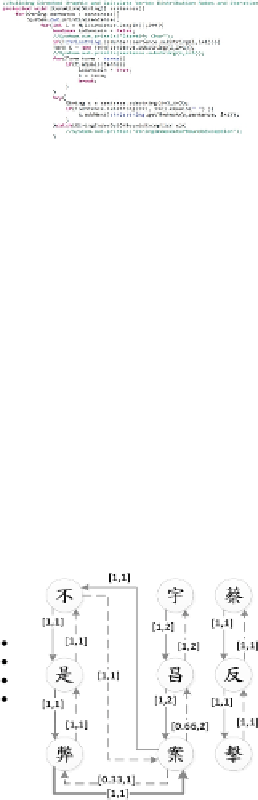
FIGURE 6
A fractional code of iterative merging.
3.2.1 Step 1: Build a directed graph
A directed graph (or digraph) is a set of nodes connected by edges, where the edges have a
direction associated with them. For example, an arc (
x
,
y
) is considered to be directed from
x
to
y
, and the arc (
y
,
x
) is the inverted link.
Y
is a direct successor of
x
, and
x
is a direct predecessor
of
y
.
We
use
the
string:
“
:
,
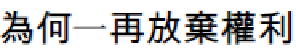
, …” (Tsai fired back and stated
that Yu Chang case is not a scandal, why did you keep asking for this and why the National
Development Fund abandoned its rights repeatedly?) as an example to explain the construc-
tion process. After removing duplicate characters and replacing punctuations with new lines,
means the inverted link.
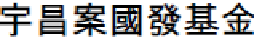
FIGURE 7
A fraction of digraph.
3.2.2 Step 2: Calculate average distribution rate and degree to concatenate
vertices
This step is to calculate the average distribution rate (ADR or intensity) and the number of
links (degree) of a digraph. To determine whether two vertices can be concatenated, we ap-
(1)


Search WWH ::

Custom Search