Image Processing Reference
In-Depth Information
able for this step because of boundary effects, which degraded overall performance sub-
stantially. The boundary of the chest wall of faty tissues may be smoothed out to be close
• Resampling to original resolution and using it for correcting original volume.
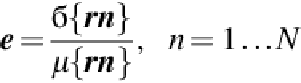
• Terminating the iterations using the variation coefficient, as follows:
(14)
where
rn
is the ratio between subsequent field estimates at the location,
б
is the standard de-
viation, and
μ
is the mean.
When
e
falls below determined threshold, the iteration is stopped. In this chapter, breast MR
images including variety percentages of bias field were used.
By using mentioned method, the bias field is removed and the specialist can assess and
quantify the density of the breast accurately, and also the bias field corrected images are ready
for another processing such as segmentation.
More importantly, segmentation and bias field estimation are mutually influenced by each
other and the performance of MRI segmentation can be degraded significantly by the presence
of bias field. If the bias field is corrected, the segmentation would be more powerful and it
helps to specialist to have an accurate assessment.
3 Experimental Results
This chapter demonstrated recent progress on MR image bias field correction. As mentioned
above there are different methods, which are popular to bias field correction such as low pass
filtering and statistical methods. Low pass filtering techniques are fast, easy to code, in addi-
tion, they can also be adaptive to image data. One of the main disadvantages of low pass ilter-
ing method is assuming the bias field as low-frequency signal. This methods also assume that
the other image component have higher frequency, which is usually wrong for some cases. In
addition, they tend to corrupt low-frequency components in tissue.
Statistical techniques are easy to integrate with other knowledge such as registration, seg-
mentation, or some image feature but one of the disadvantages of these methods is that they
often have relied on Gaussian distribution for modeling the intensity distribution of tissues,
but experimental results show that intensity distribution of tissue do not indicate a Gaussian
Overall, the N3 method is superior to the other methods in robustness and high perform-
ance point of view [
27
].
In this part, we show the efficacy of proposed algorithm for clinical breast MRIs. All of the
images were acquired by 1.5 T clinical MR scanner in “Isfahan radiology Medical Center.”
Fig-
ure 1(a)
demonstrates a breast MR image corrupted by bias field and bias field corrected im-
age using mentioned algorithm.
Search WWH ::

Custom Search