Image Processing Reference
In-Depth Information
According to
Table 3
, edge PSNR shows higher value of correlation compare to common
PSNR and nonedge PSNR. Also, Pearson coefficient is much higher than Spearman result
which indicates the distribution is nonlinear. In this case, Spearman and Kendall results are
more reliable.
Sharpness degree and blur metric show negative and positive correlation values, respect-
ively. These two results confirm the fact that image with high spatial frequency (sharper) re-
SSIM uses luminance, contrast, and structure features to measure quality. Similar to PSNR,
Pearson coefficient is higher than two other correlation coefficients in this metric. SSIM has the
highest Spearman value among other metrics. Thus, it is the most similar metric to visual fa-
tigue in the case of samples order.
VIF results are based on NSS, HVS, and an image distortion (channel) model in wavelet do-
main and shows a positive but low correlation to visual fatigue.
BIQI and NIQE are two NR IQA metrics that are expected to show lower correlation in com-
parison to FR IQA metrics. JPEG, JPEG2000, white noise, Gaussian Blur, and Fast fading are
ive distortions that are considered in BIQI method for quality measurements. Similar to neg-
ative results of sharpness degree, BIQI is not correlated with subjective results.
NIQE metric delivers a positive correlation using Pearson coefficient. Also, Spearman and
Kendall correlation results are comparative to some results derived from FR IQA methods.
NIQE results are close to VIF, therefore, it can be inferred that NIQE is an acceptable quality
assessment tool when there is no access to reference image.
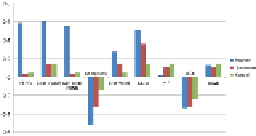
Figure 4
shows correlation values
for different quality metrics in column diagram mode.
FIGURE 4
Column diagram of correlation between image quality metrics and subjective eval-
uation in descending order using Pearson, Spearman, and Kendall.
5 Conclusion
In this article, the performance of 2D objective quality tools for 3D quality evaluation is stud-
ied. Seven upsampling algorithms that yield different artifacts are implemented to construct
high-resolution depth maps. Comparing the quality evaluation results of upsampled depth
maps with subjective ratings of reconstructed stereoscopic images, we successfully achieved
a reasonable relation between objective IQA results and subjective assessment. As a result,
PSNR and SSIM show the highest Pearson correlation coefficients. Sharpness degree has a neg-
ative correlation which indicates that the sharp edge is a reason for visual discomfort. Also,
VIF is not an appropriate tool due to small correlation coefficient.
References
[1] Urvoy M, Barkowsky M, Le Callet P. How visual fatigue and discomfort impact 3D-
TV quality of experience: a comprehensive review of technological, psychophysical,
and psychological factors.
Ann Telecommun.
2013;68(11-12):641-655.
Search WWH ::

Custom Search