Image Processing Reference
In-Depth Information
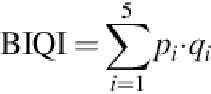
tortion in the image is denoted as
p
i
{
i
= 1,2,…,5}. The method performs quality assessment
in two stages. This irst stage is a classiication and the second stage atempts to evaluate the
quality of the image along each of these distortions. The quality of the image is then expressed
as a probability-weighted summation:
(5)
where
q
i
{
i
= 1,2,…,5} represents the quality scores from each of the five quality assessment al-
gorithms (corresponding to the five distortions).
2.2.4 Natural image quality evaluator
that only uses measurable deviations from statistical regularities observed in natural images,
without training on human-rated distorted images. Unlike current general purpose NR IQA
algorithms which require knowledge about anticipated distortions in the form of training ex-
amples and corresponding human opinion scores, NIQE uses a quality aware collection of
statistical features based on the simple and successful space domain, the NSS model. These
features are derived from a corpus of natural, undistorted images.
The quality scores for both BIQI and NIQE are expressed by a value between 0 and 100 (0
represents the best and 100 the worst quality).
3 3D Subjective Quality Assessment
During the subjective quality evaluation, the quality of each reconstructed stereoscopic image
is rated by observers according to double stimulus continuous quality scale subjective test, as
described in the International telecommunication union's recommendation on subjective qual-
ity assessment [
20
]
. Fifteen nonexpert observers are participated in this experiment. In the irst
stage, original stereoscopic images were displayed to each participant for 10 s and another ste-
reoscopic image made by an upsampled depth map for the same period of time. For each im-
age data, similar viewing was carried out in order to examine the 3D perception. Depth per-
ception is subjectively judged based on scales of 1 (bad), 2 (poor), 3 (fair), 4 (good), and 5 (ex-
cellent) in terms of 3D perception.
To detect outliers, a rejection analysis was performed on subjective results. An observer rat-
ing is considered as outlier if the correlation between Mean Opinion Score (MOS) and subject's
rating results for all images is less than 0.7. According to correlations, there were no outliers
among subjects.
Search WWH ::

Custom Search