Image Processing Reference
In-Depth Information
measure the lineal correlation between the original
α
(
ν
,
r
) applied during the F-pSQ process
and the recovered .
Table 2
shows that there is a high similarity between the applied
VFW and the recovered one, since their correlation is 0.9849, for gray-scale images, and 0.9840,
for color images.
Table 2
Correlation Between
α
(
ν
,
r
) and
Across CMU, CSIQ, and IVCIMAGE Databases
Image Database 8 bpp Gray-Scale 24 bpp Color
CMU
0.9840
0.9857
CSIQ
0.9857
0.9851
IVC
0.9840
0.9840
Overall
0.9849
0.9844
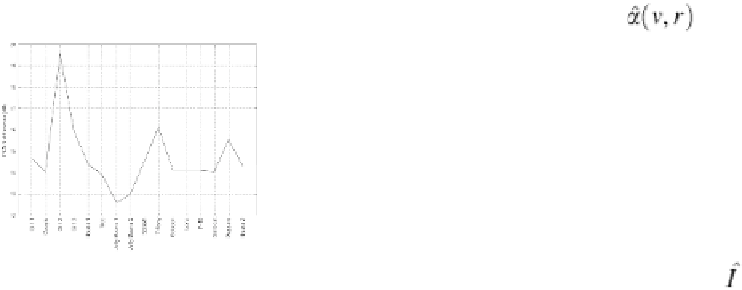
Figure 6
depicts the PSNR difference (dB) of each color image of the CMU database, that is,
the gain in dB of image quality after applying at
d
= 2000 cm to the images. On av-
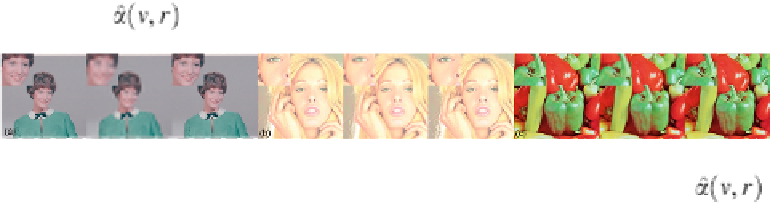
erage, this gain is about 15 dB. Visual examples of these results are shown in
Figure 7
, where
the right images are the original images, central images are perceptual quantized images after
applying
α
(
ν
,
r
), and left images are recovered images after applying
.
FIGURE 6
PSNR difference between
Q
image after applying
α
(
ν
,
r
) and recovered
after
applying
for every color image of the CMU database.
FIGURE 7
Visual examples of perceptual quantization. Left images are the original images,
central images are forward perceptual quantized images (F-pSQ) after applying
at
d
= 2000 cm, and right images are recovered I-pSQ images after applying
. (a) Girl 2.
(b) Tiffany. (c) Peppers.
After applying , a visual inspection of these 16 recovered images shows a perceptu-
ally lossless quality. We perform the same experiment for gray-scale and color images with


Search WWH ::

Custom Search