Image Processing Reference
In-Depth Information
Table 2
Training and Testing Sets
Trout Size Training Testing
Fry
150
300
Fingerling 150
300
Table-fish 150
300
Total
450
900
3. From these 450 training images, training data are gathered, which in fact consist of training
lengths, the arithmetic mean, and the standard deviation for each size.
To do this, we gather an RGB image using our prototype. Then, we execute a five-stage im-
age processing: gray-scaling, filtering, thresholding, closing, and contouring. Next, we es-
timate the trout's length by applying our statistical approach to the contour obtained above.
Finally, using this estimated length we classify the trout as fry, fingerling, or table-fish.
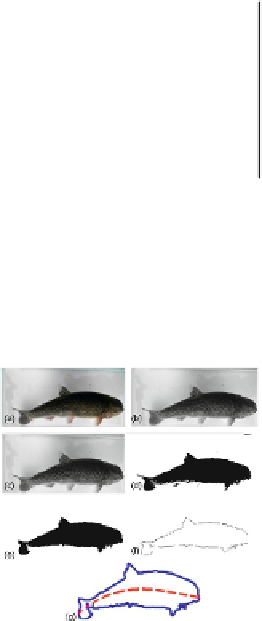
FIGURE 5
Image processing performed to measure a rainbow trout using our statistical ap-
proach. (a) RGB incoming image sensed by the vision system; (b) gray-scaling; (c) filtering;
(d) thresholding; (e) closing; (f) contouring; and (g) trout's length estimated by a third order re-
gression curve (plotted as dash line).
5. To speed up our image-processing step, our vision system gathers [640 × 360] pixels RGB-
images.
6. Captured RGB values are converted into a grayscale by forming weighted sums of the R, G,
(4)
7. Noise reduction is performed in every grayscale image by using a [3 × 3] Gaussian low-pass
ilter and
σ
= 0.6


Search WWH ::

Custom Search