Image Processing Reference
In-Depth Information
4.1 Testing Procedure
standard algorithms in the literature [
16
,
17
]
until we obtain the trout's contour. Next, we apply
our statistical approach to that contour, so we can estimate the trout's length. Finally, a binary
classiication approach is taken to classify the trout within the income image. We now detail
our experimental procedure:
1. As mentioned before, we have collected a trout-image database using our prototype (illus-
trated in
Figure 4
) in a farm. This database was created using 30 fry, 30 fingerling, and 30
30table-fish specimens, capturing 20 images per specimen. This state-of-the-art rainbow trout
image database (see
Table 1
) was recently collected for this publication. However, for this
experiment we are using only 450 images per size.
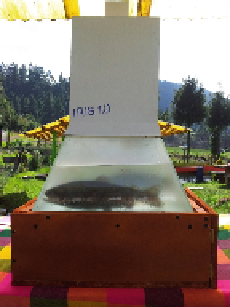
FIGURE 4
Functional prototype used within our measuring system. This prototype includes
an illumination source, a pyramidal canalization compartment and a 2D camera.
Table 1
Experimental Data Images
Trout Size Specimens Images Per Specimen Total Images
Fry
30
20
600
Fingerling
30
20
600
Table-fish
30
20
600
Grand total 90
1800
2. From our database, separate training and testing sets are defined (see
Table 2
). Thus, 450
images for training and 900 images for testing are used. Specifically, we have three train-
ing data sets, containing 150 images per size, namely, fry, fingerling, and table-fish trout. In
every case, we selected the first five-captured images for each of the 30 specimens per size
to be part of the training set. Then, we use the next 10-captured images for each of the 30
specimens for testing. By doing this, we have three testing sets (one per trout-size) contain-
ing 300 images of fry, fingerling, and table-fish, respectively.


Search WWH ::

Custom Search