Image Processing Reference
In-Depth Information
Then, we observe that this regression curve is related to the trout's length, which could be
estimated by computing the Euclidean distance among the points within the regression curve.
Finally, given a probe-length (
l
i
) a classification can be done by comparing against training
lengths. For this research, such comparison is performed by computing the Mahalanobis dis-
(3)
Hence, a probe-trout
t
i
is classified through its estimated length
l
i
by comparing its Mahalan-
obis distance
d
i
against a predefined threshold, which in fact is the number of standard devi-
ations that is expected to be to the training mean length ( ).
4 Experimental framework
This section presents the experimental framework to illustrate how rainbow trout is measured
using our statistical approach.
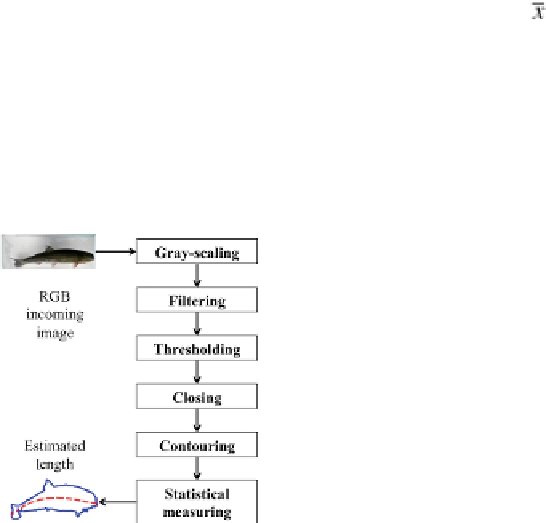
As show in
Figure 3
, after an RGB image is taken by our prototype, we are following a ive-
the trout's length using this contour.
FIGURE 3
Processing an incoming RGB image to estimate the trout's length using our stat-
istical approach.
To classify the trout's image within an image, we are performing four main steps. Firstly,
is processed to obtain the trout's contour. Thirdly, the trout's length is estimated by applying
the trout is classified using a binary classification approach.
In
Section 4.1
, we provide more detail about our image processing step.


Search WWH ::

Custom Search